The company's product sits behind loyalty apps you've used without thinking about it - the coffee stamp card on your phone, the “10th one free,” the offer that lands on the morning you'd skip. For a subscription business, recurring revenue is the whole scoreboard. And when it's booked in five currencies, “how are we doing?” stops being one question: versus last month, versus target, versus last year, in local currency or converted, counted from when a deal closed or when it starts billing. Answer those from spreadsheets and you'll get a slightly different number each time.
The Challenge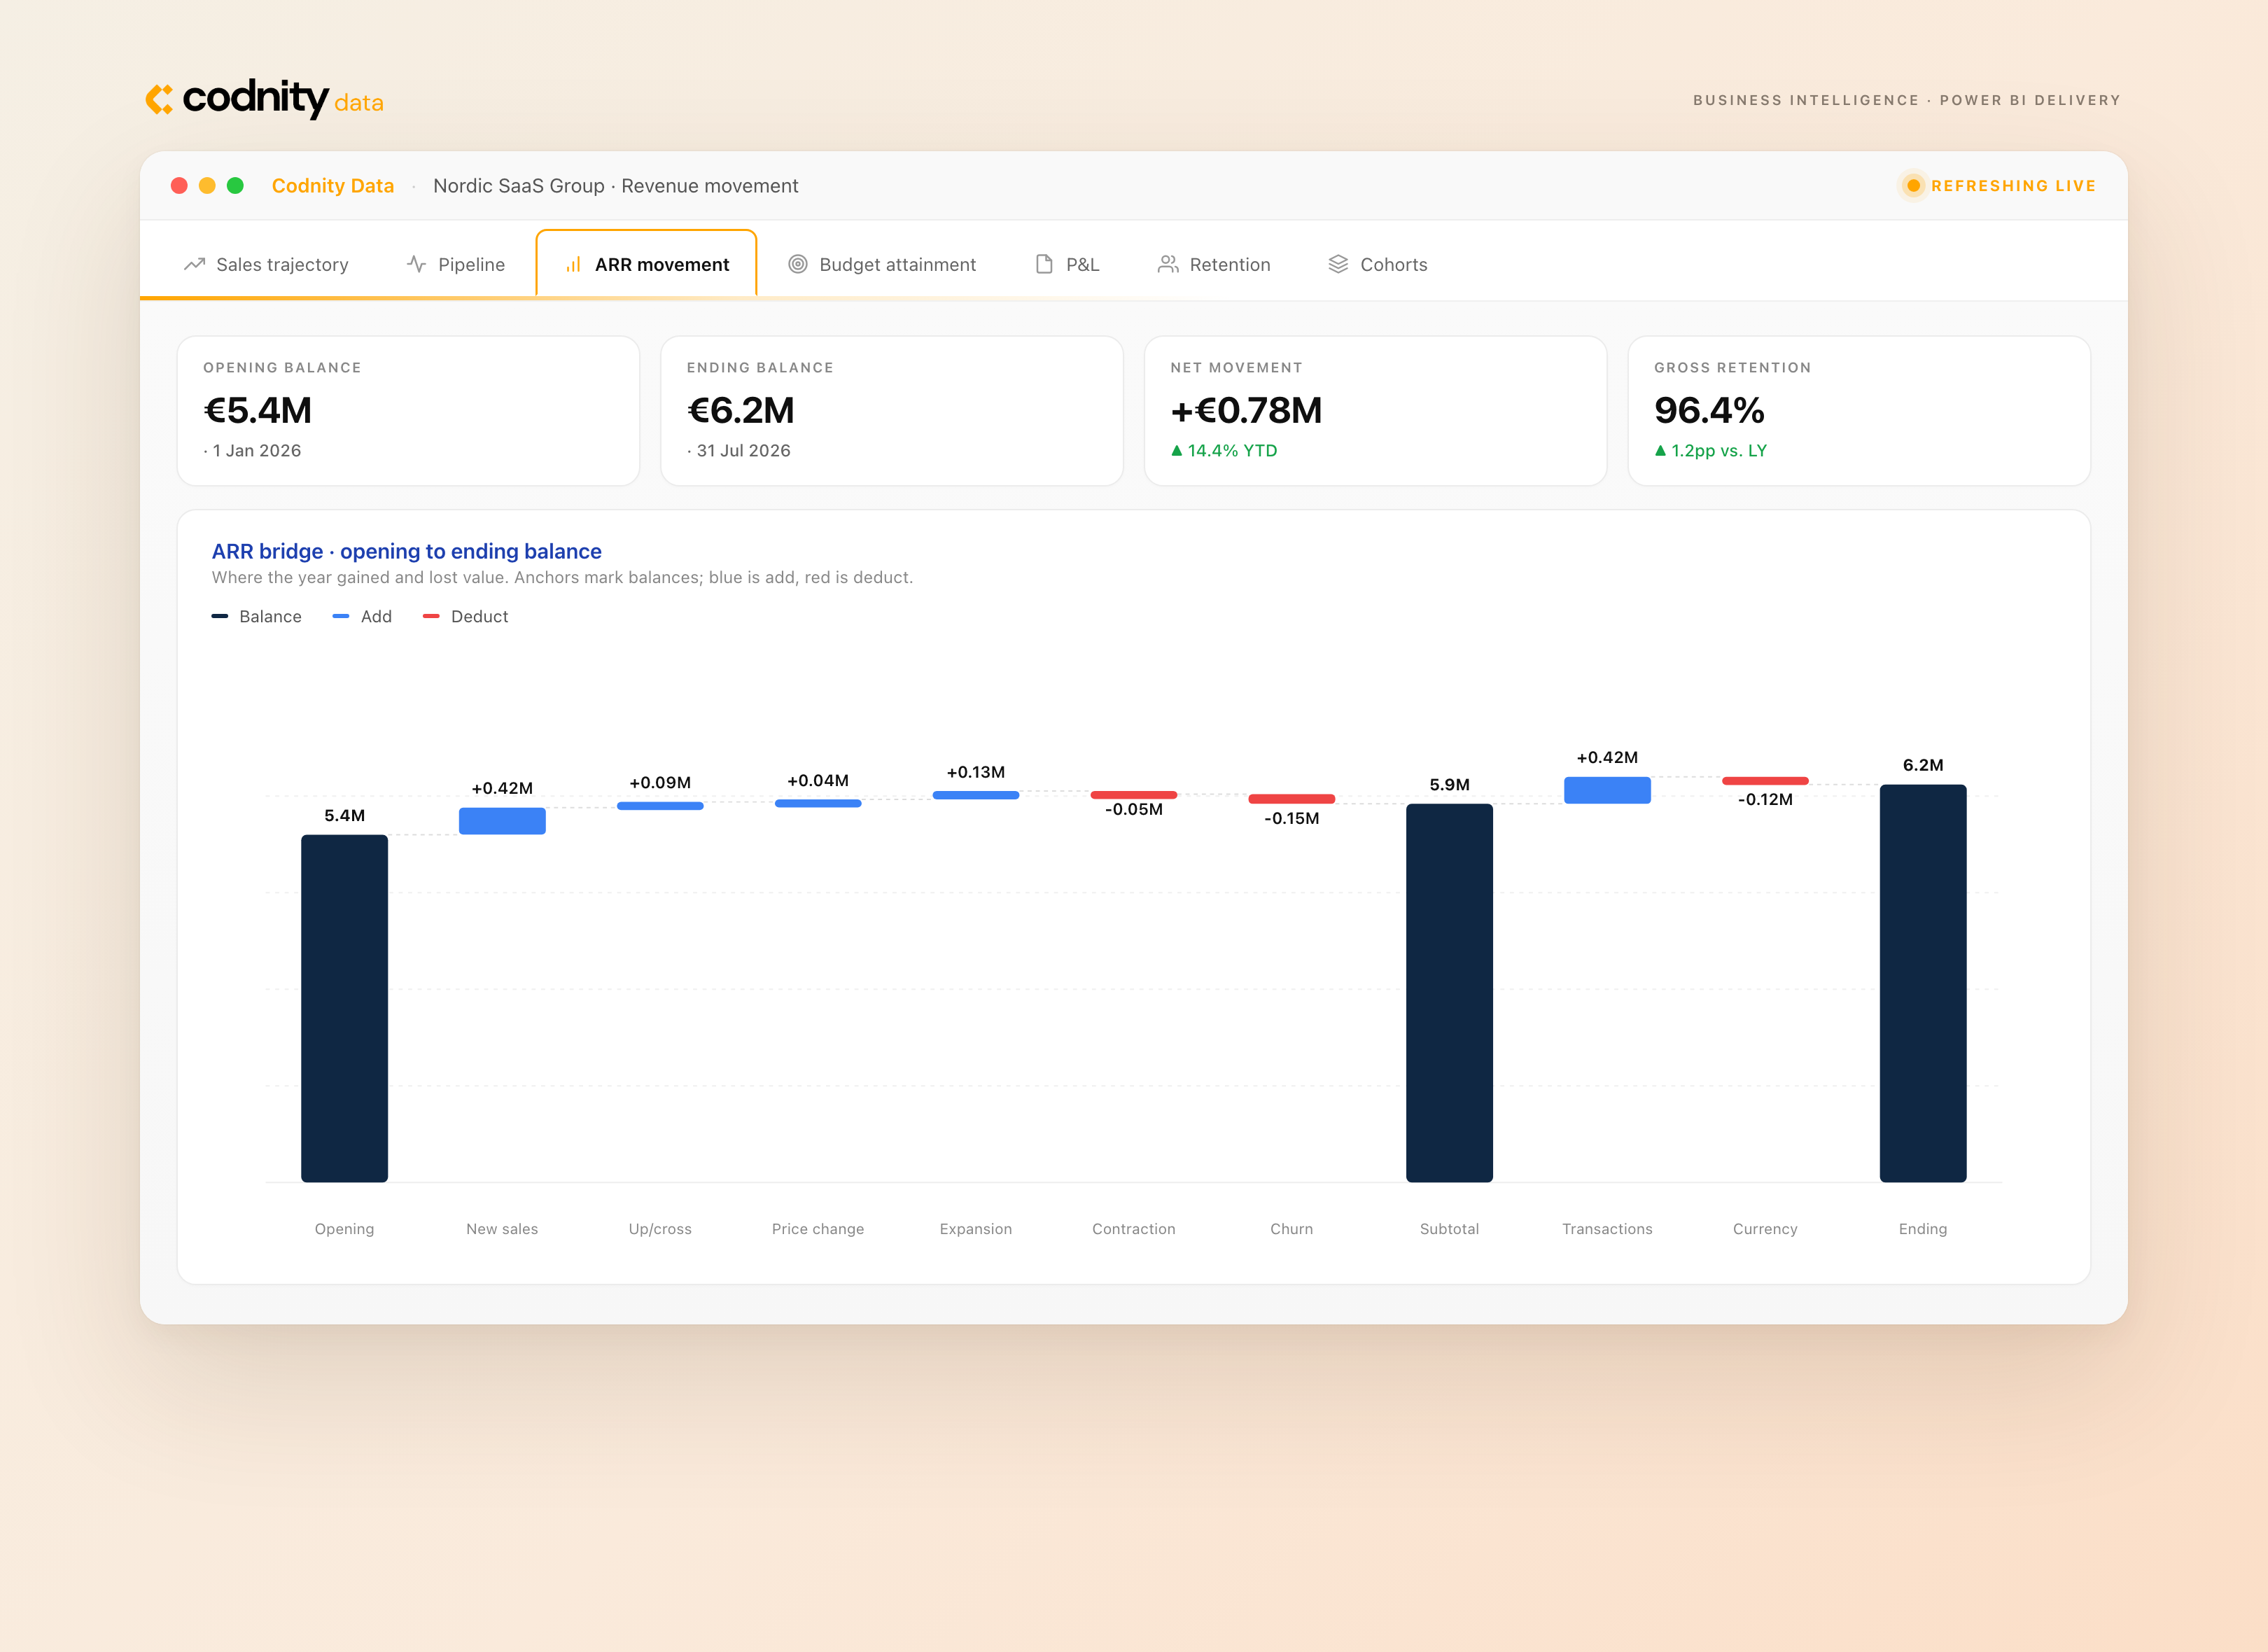
The raw material was never the problem - deals in the CRM, invoices in the finance system, monthly exchange rates from the central bank. It fell apart the moment anyone tried to turn that into one agreed number without rebuilding it from scratch each month.
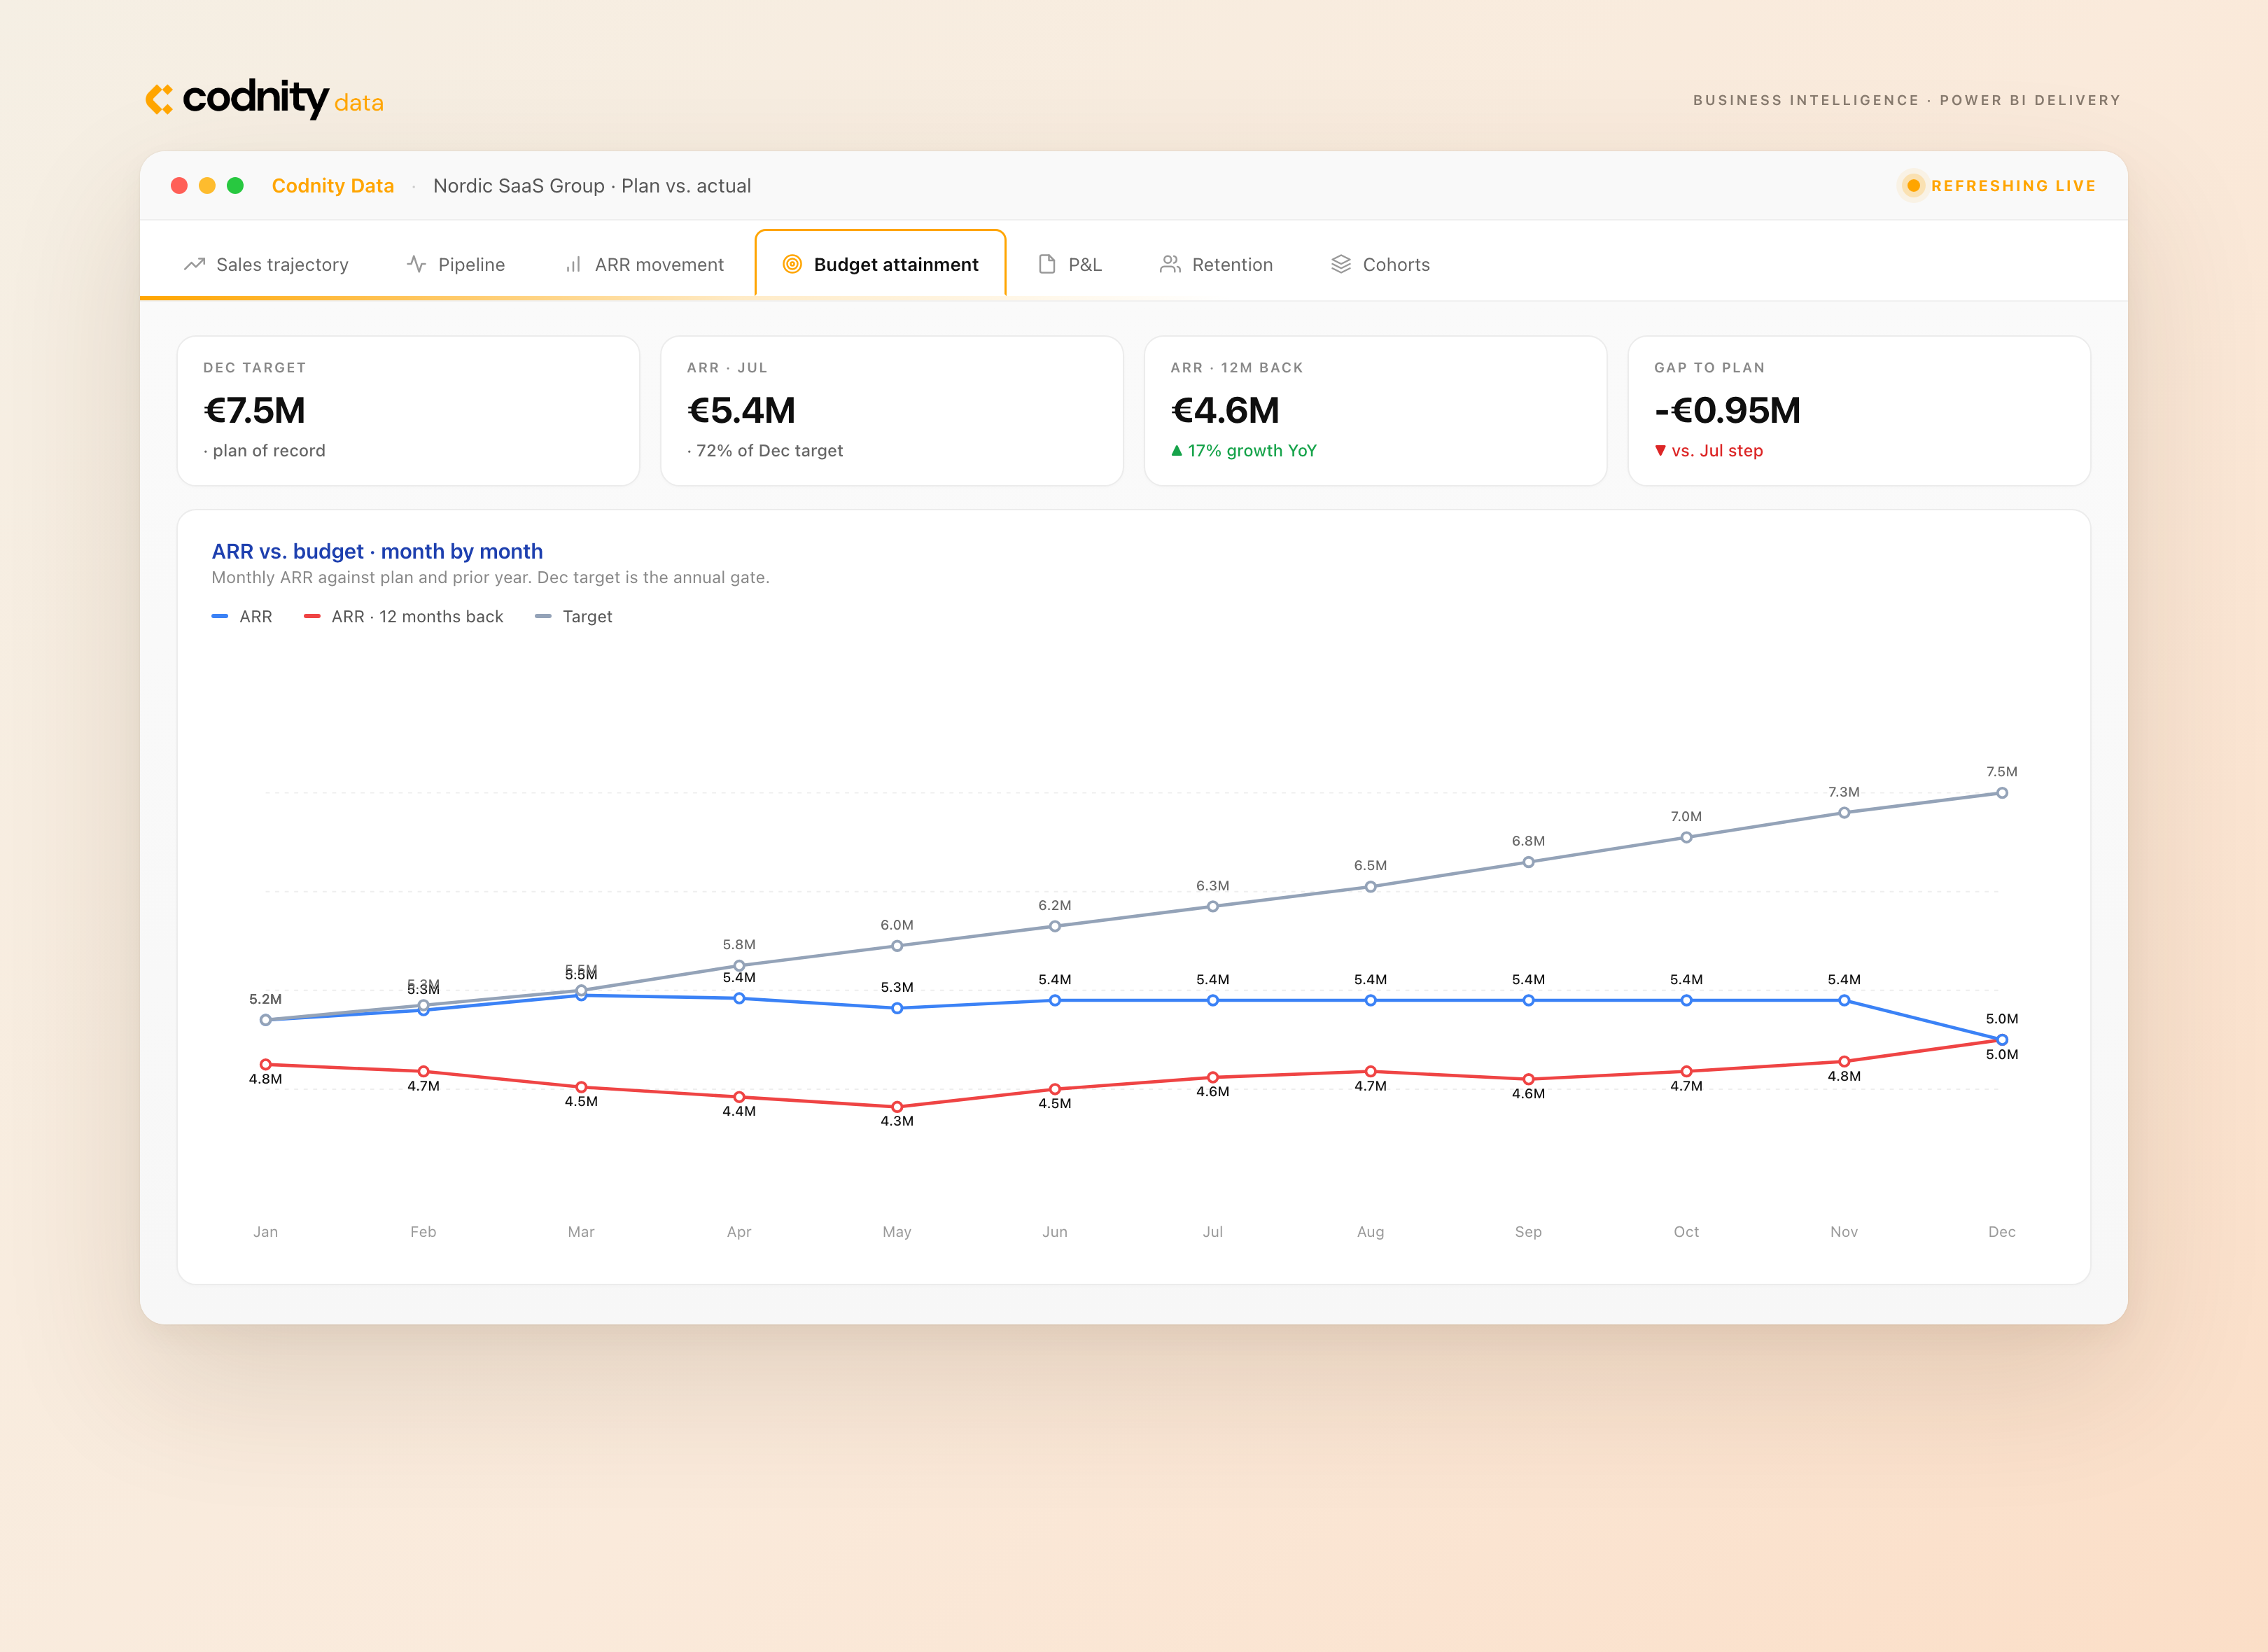
ARR is harder than it looks. A customer in Sweden pays in SEK, head office reports in NOK, and the rate that bridges the two is only published after the month has closed. Miss that and the measure doesn't throw an error - it quietly drops the row and reports less revenue than the company actually has. Do that three ways in three spreadsheets, and you get three “official” ARR numbers, each one defensible, none of them matching.
The KPIs had a different problem: they already existed, but they cost people. Pipeline, retention, burn and more were pulled together manually every cycle, so a finished board was already a little out of date - with small inconsistencies between whoever built it this month and last.
The Mission
Settle the definitions once and reuse them everywhere: one way to convert a currency, one ARR structure, one calendar. Then put the two views the business runs on - recurring revenue and operational KPIs - on top of that shared foundation, refreshed automatically. The goal: ARR trustworthy enough that people stop rebuilding it, and a KPI board that maintains itself instead of being built by hand each month.
Our Approach
We started with the basics everything else depends on: one calendar, one currency table, and a single source of ARR changes. Get those right and the two reports stop being separate projects and become one shared foundation, read two ways. The discipline that held it together:
- One shared calendar behind every time comparison - year-to-date, last twelve months, month-over-month, prior-year - so "this year so far" means the same thing everywhere you see it.
- Exchange rates applied to each amount individually, with a fallback. Every amount converts using the rate for its own currency and month. If this month's official rate isn't published yet, the model uses the most recent rate available instead of leaving the amount out. Five currencies in, one consistent number out - nothing gets silently missed.
- Both dates kept on the same underlying records, so the sold-date view and the effective-date view can never drift apart from each other.
Report one - Annual Recurring Revenue
What ARR is, and why it runs the business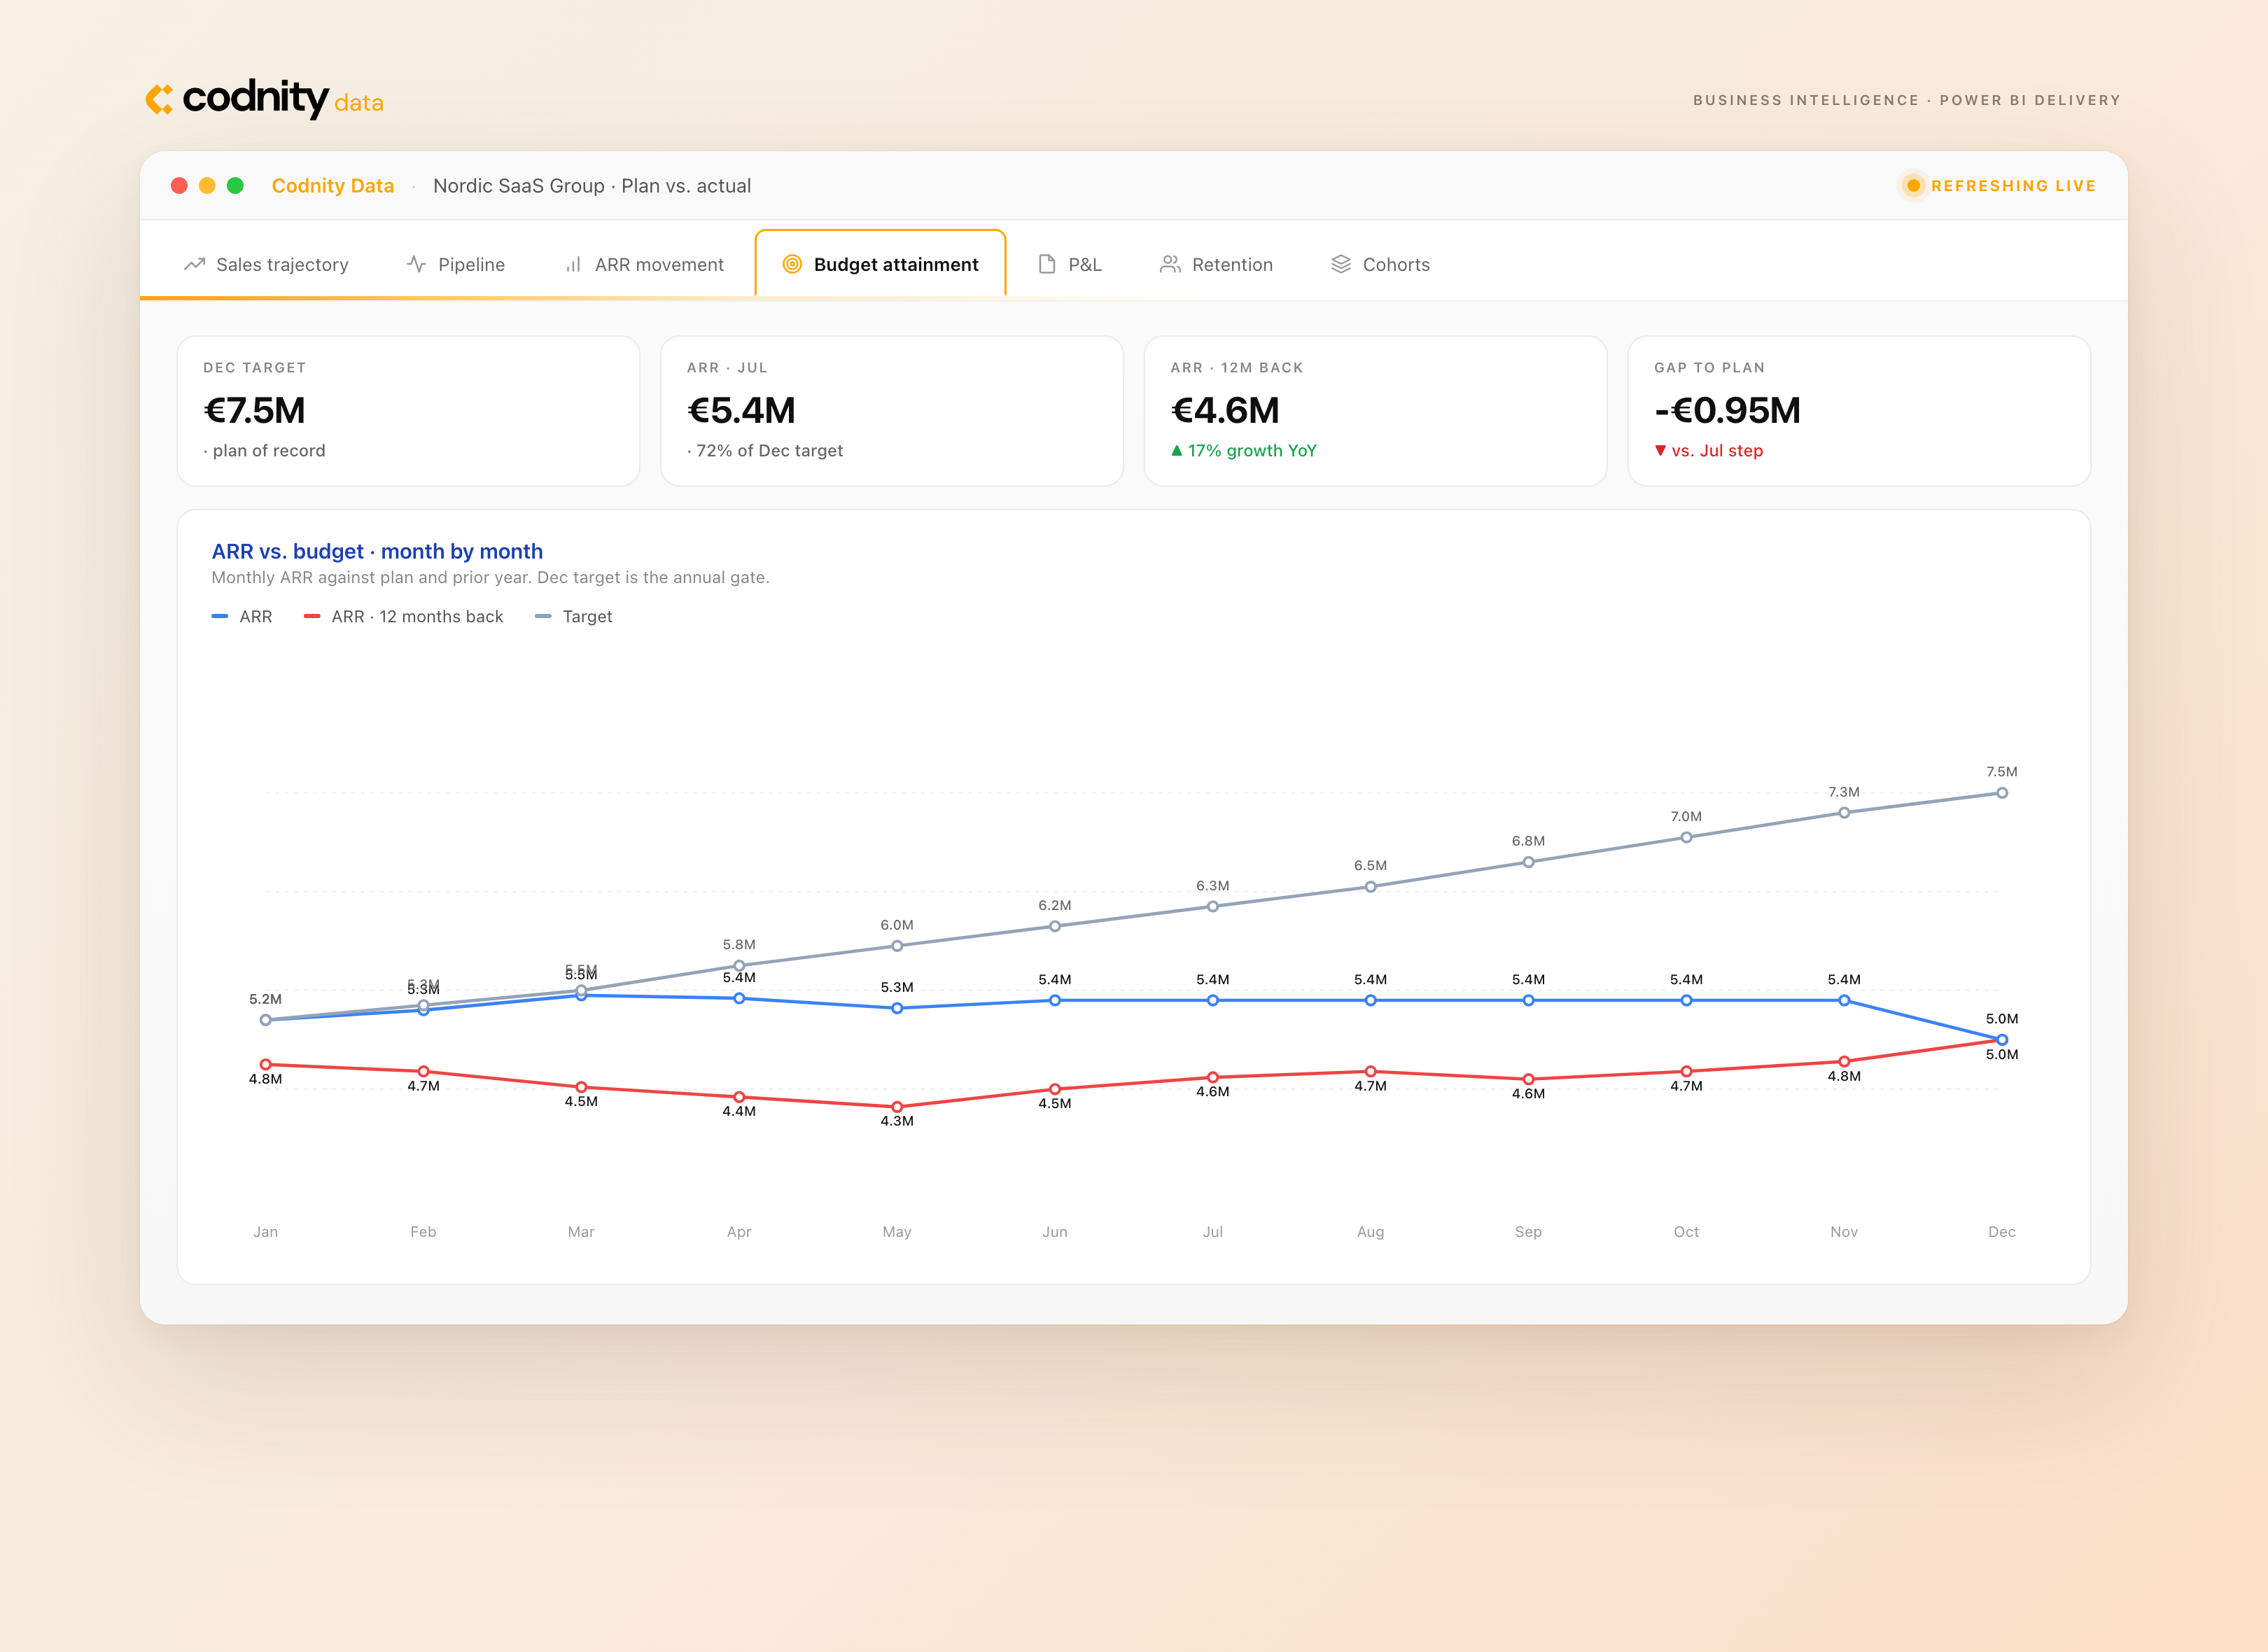
Annual Recurring Revenue is the yearly value of every active subscription the company holds - the revenue it keeps earning as long as customers stay. It's what growth is measured against, what planning and hiring are sized against, and what the company is valued on.
What actually makes up ARR
ARR doesn't move for no reason - each month's change has a cause: new customers, existing ones buying more, contracts growing or shrinking, price changes, or customers leaving. Currency swings are shown separately, so a weaker krone is never mistaken for lost customers. Leadership sees why ARR changed, not just that it did.
Why this beats the old spreadsheet
Because the numbers update automatically, ARR can be checked any day, not just at month-end - so a churn spike or a growth jump shows up that week, early enough to respond. And where the old total shifted with whoever built the spreadsheet, the automated version applies the same rules every time, exchange-rate safety net included: the same figure whether you check it today or after close, with no rebuild.
Report two - Company-wide KPIs
From a manual monthly build to a live board
Automating this put every department's KPIs in one place, refreshed on its own, each shown as actual versus target. What used to be a monthly copy-and-check scramble across separate sources - real hours before anyone could even look at a trend - is now a single refresh.
What the board now tracks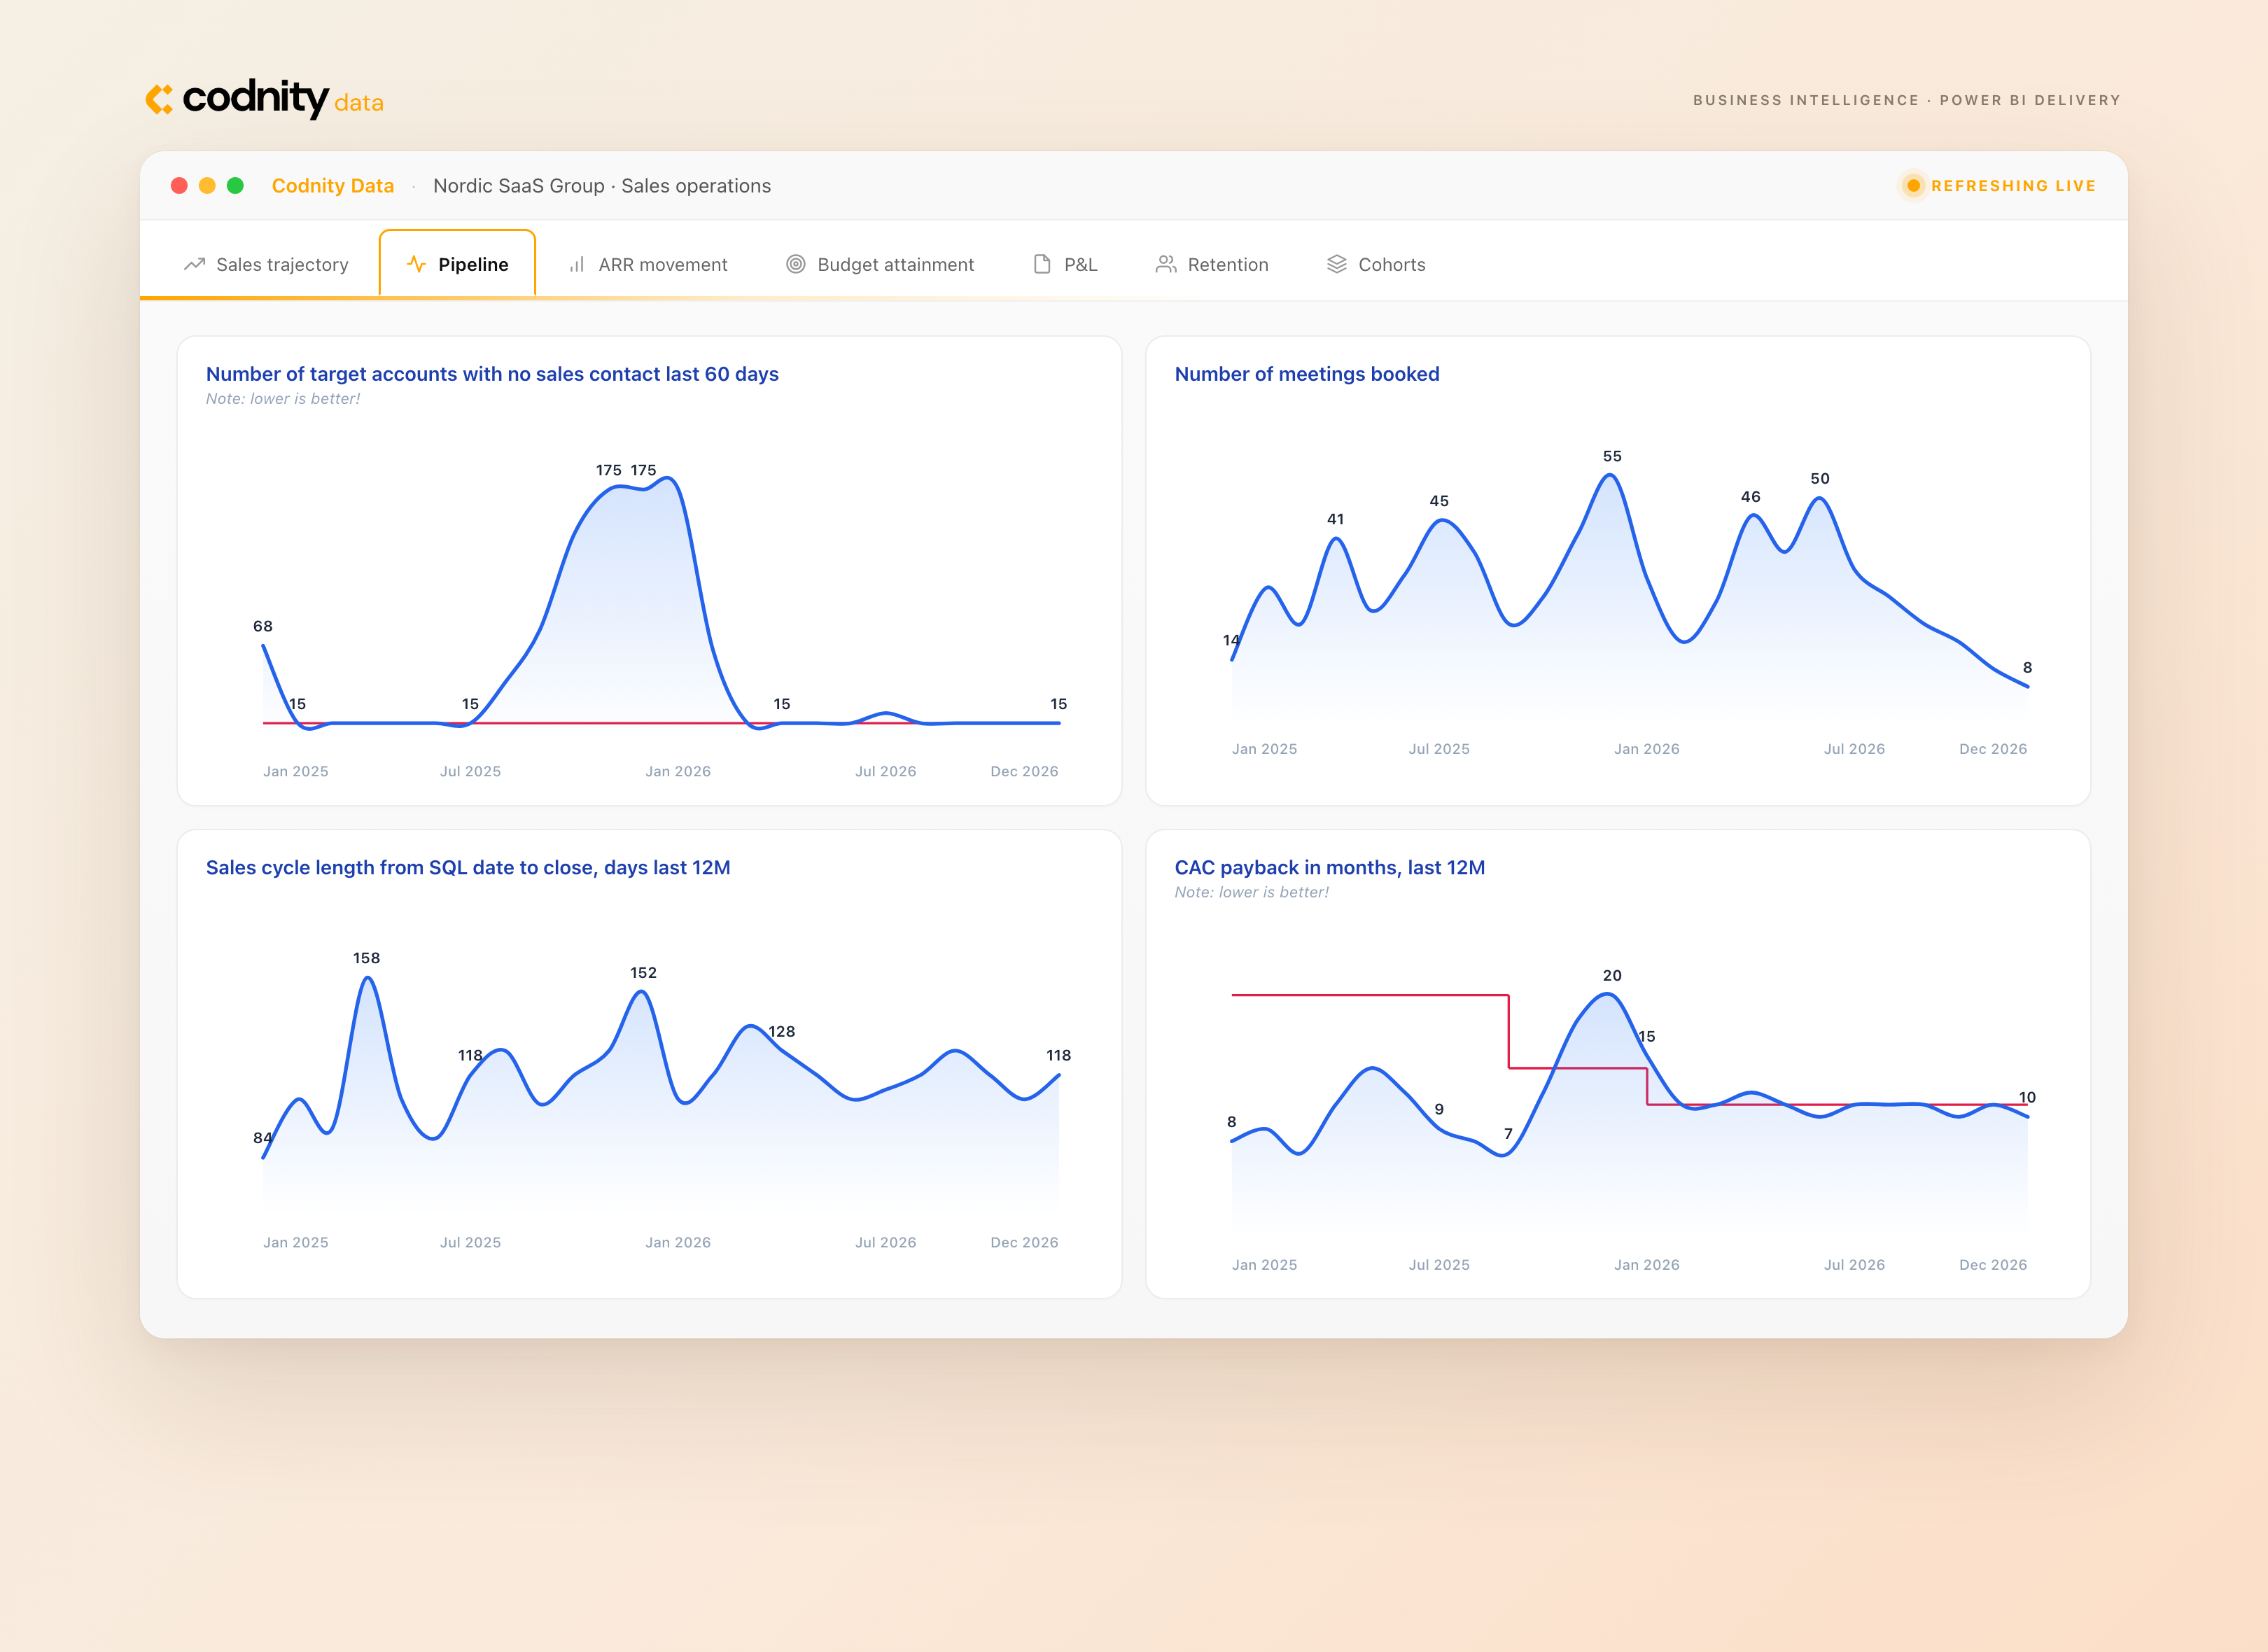
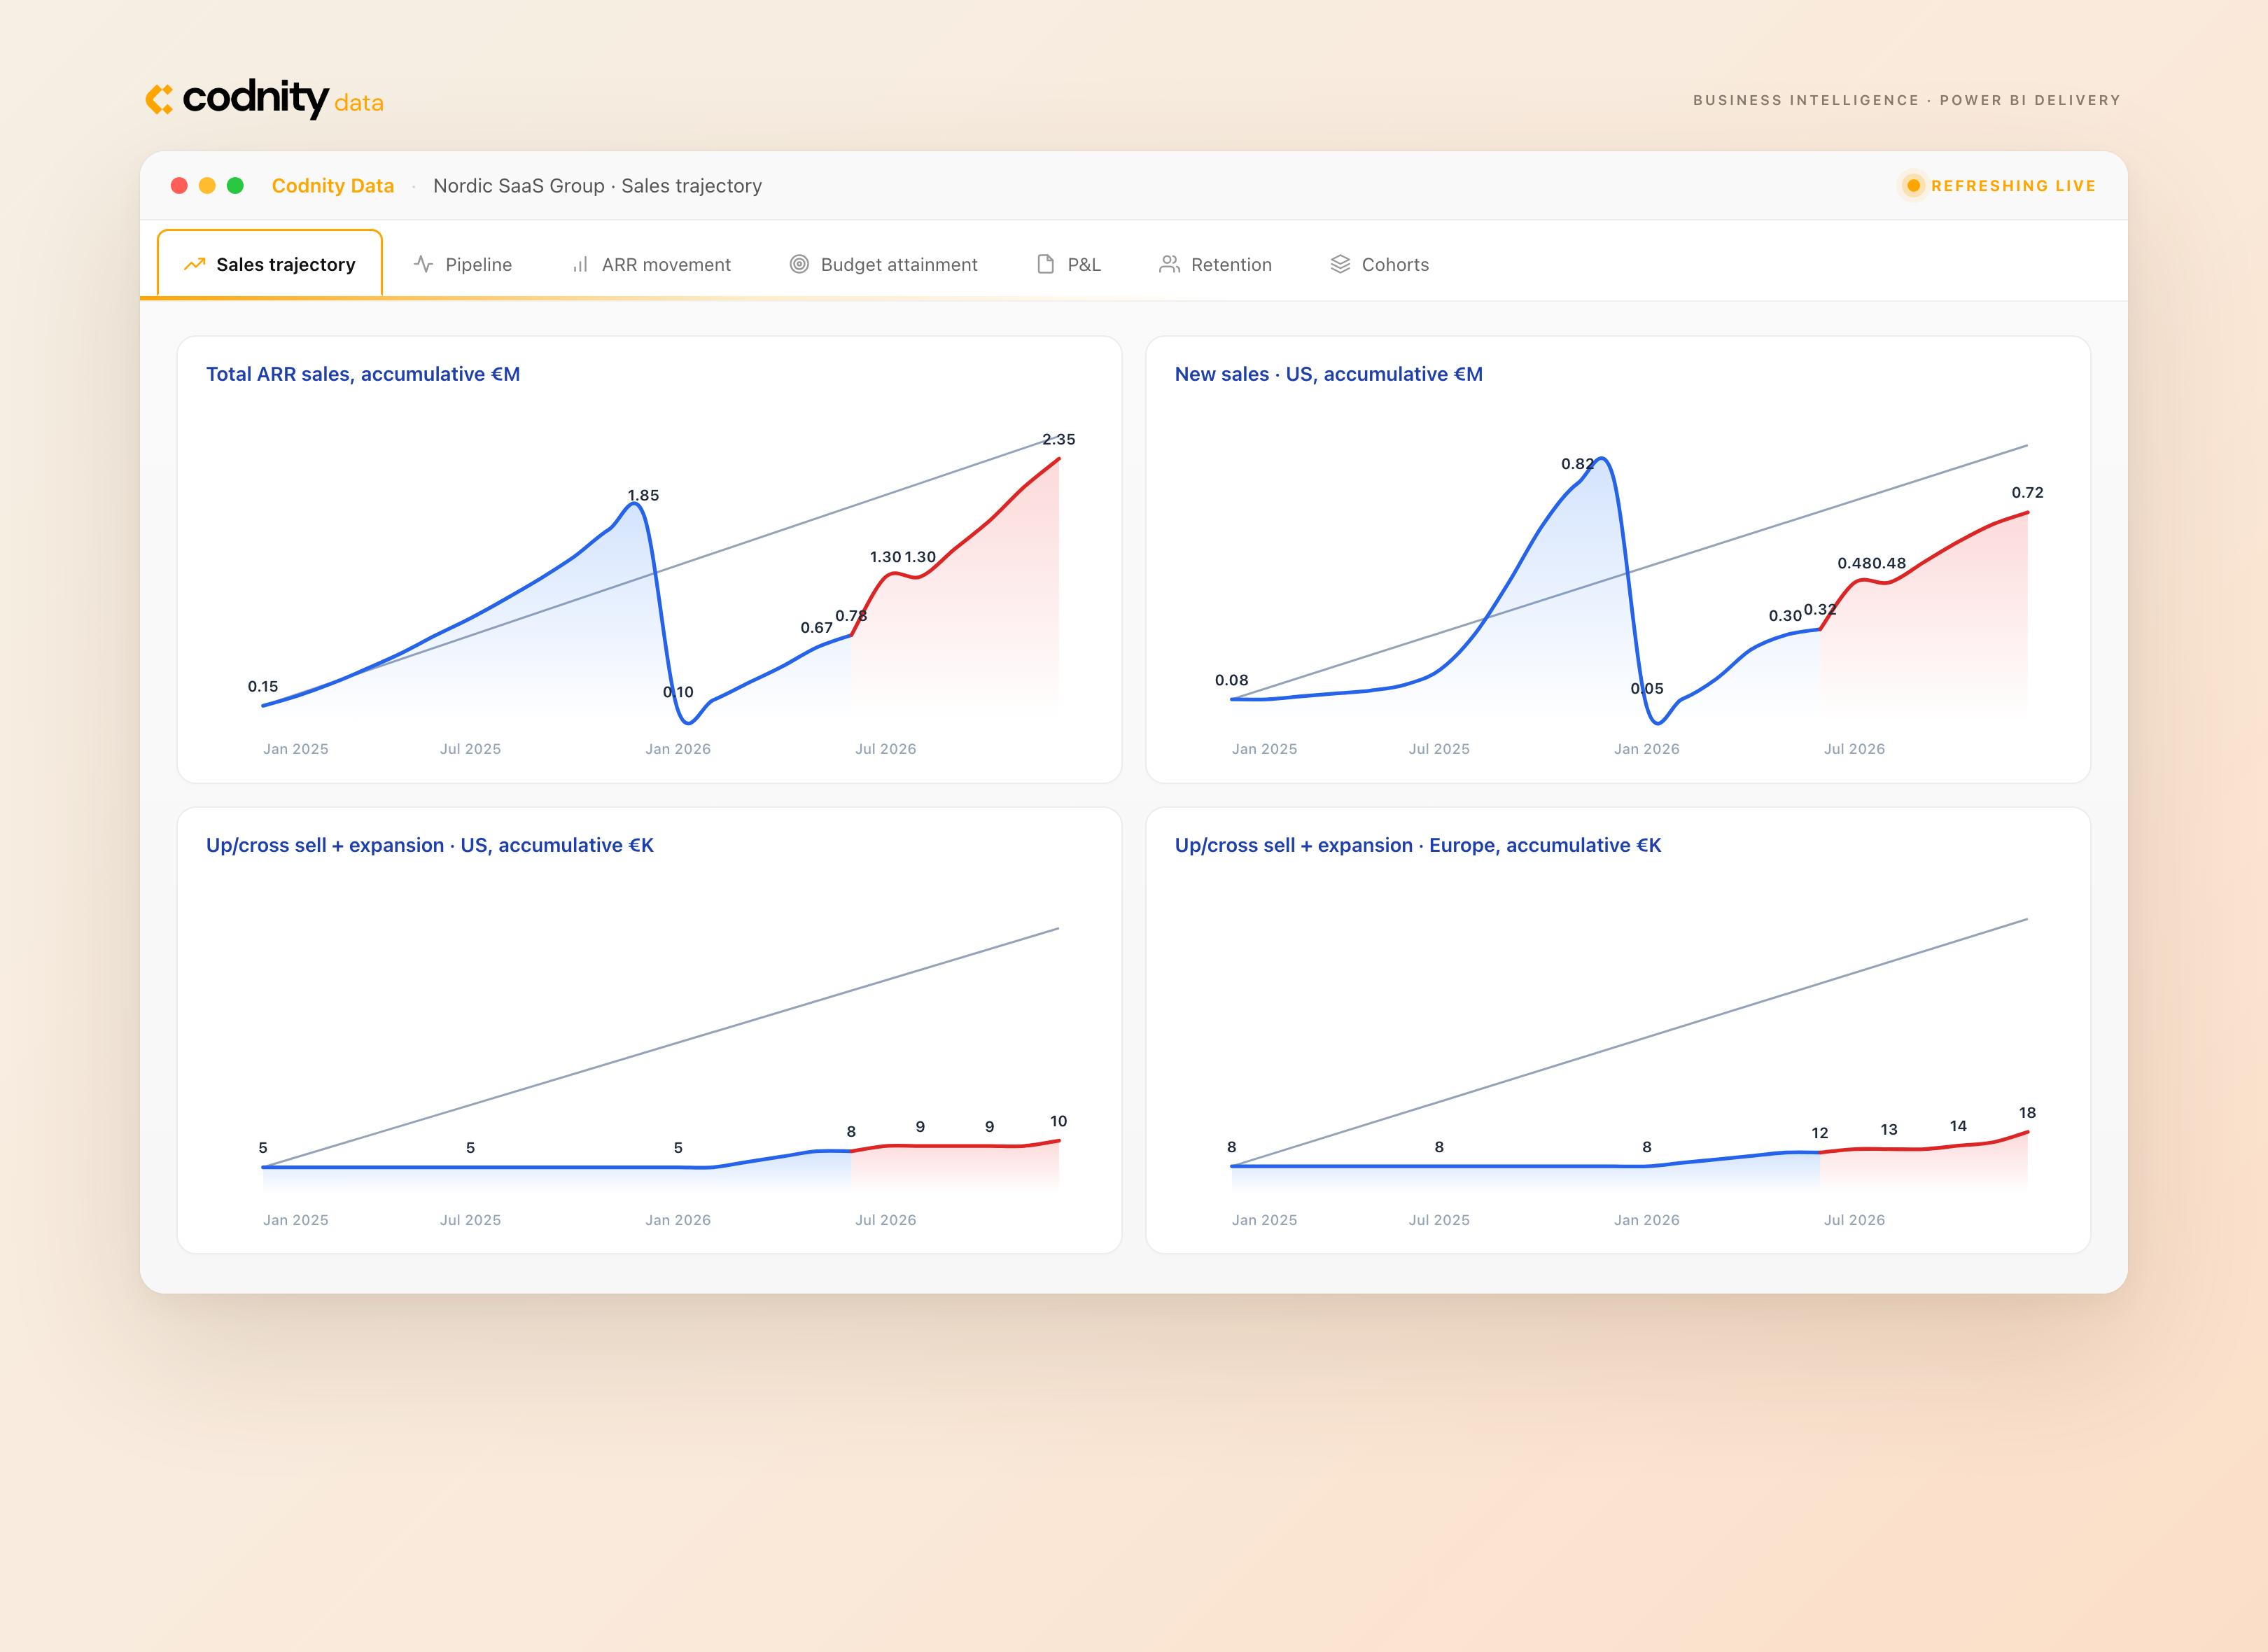
Sales sees pipeline value, sales-cycle length, cost of acquisition, and quota coverage. Marketing tracks qualified leads, cost per lead, meetings booked, and email performance. Customer success watches churn, renewals, NPS, and retention. Operations covers uptime, cost of goods, and support load. Finance and leadership see ARR per employee, burn rate, runway, and R&D spend - with US and Europe tracked separately wherever revenue is involved, since the two markets work differently.
Why these KPIs matter to them
Each metric is an early warning for a specific risk: cost of acquisition and quota coverage show whether sales spending works; churn and retention, whether growth leaks out faster than it comes in; burn and runway, how much time is left to fix things; uptime and support load,
whether the product can take more customers. Together they let leadership adjust course weekly, not just at quarter-end.
What Changed
The two reports agree with each other now - which sounds obvious until you've lived without it. The ARR in the revenue report and the ARR shown on the KPI board are the same number, same logic, same calendar. Nobody asks why the two don't match anymore, because they do.
The KPI board is a refresh now, not a monthly assembly job, so the hours that went into building it go somewhere more useful. And “how are we doing this year” is a click away, not an afternoon of exports and stitching.
Last Words
Growing companies are good at breaking their own spreadsheets - a new currency, a new deal type, a new team structure, something the old setup never planned for. This one is built to absorb that: shared definitions, a safety net for missing exchange rates, and one revenue structure that reads however each team needs. It didn't make the dashboards prettier; it made ARR something people trust without double-checking, and turned the KPI board from a monthly chore into one that keeps itself current.
If your own revenue numbers start slipping the moment a new currency or team enters the picture, or your KPIs still live in a spreadsheet someone rebuilds every month, let's talk.
Frequently asked questions
We already have spreadsheets. Why change?
Which KPIs does the board track?
How "live" is a live report, really - is it real-time?
Published · Updated · Last reviewed
Reviewed by Elvijs Veide, Co-founder