What Our Operational Reporting Services Include
We build complete operational reporting environments. Every engagement is scoped to your workflow landscape - these are the core capabilities we deliver.
CRM & Pipeline Analytics
Sales pipeline dashboards, conversion funnel analysis, lead scoring visibility, revenue forecasting, and customer lifecycle metrics built on live CRM data.
- Sales pipeline dashboards
- Conversion funnel analysis
- Lead scoring visibility
- Revenue forecasting
- Customer lifecycle metrics
Project & Delivery Reporting
Integration with ClickUp, Monday.com, Asana, and Jira for sprint velocity tracking, resource utilization, delivery timeline analysis, and bottleneck identification.
- ClickUp, Monday.com, Asana, Jira integration
- Sprint velocity tracking
- Resource utilization dashboards
- Delivery timeline analysis
- Bottleneck identification
Workforce & Capacity Analytics
Team utilization rates, capacity planning dashboards, time tracking integration, department performance comparison, and headcount efficiency metrics.
- Team utilization rates
- Capacity planning dashboards
- Time tracking integration
- Department performance comparison
- Headcount efficiency metrics
Multi-System Integration
REST API connectivity, CRM + ERP + PM tool unification, automated data refresh, cross-platform data normalization, and real-time sync architecture.
- REST API connectivity
- CRM + ERP + PM tool unification
- Automated data refresh
- Cross-platform data normalization
- Real-time sync architecture
AI-Enhanced Operational Insight
Natural language operational queries, anomaly detection for KPI drift, predictive capacity modeling, and Claude-assisted operational exploration.
- Natural language operational queries
- Anomaly detection for KPI drift
- Predictive capacity modeling
- Claude-assisted operational exploration
How We Deliver
Every operational reporting project follows a structured methodology designed to unify data sources, align KPIs, and deliver real-time performance visibility from day one.
Operational KPI Definition
Define delivery, utilization, pipeline, and performance metrics aligned with business objectives.
System Mapping & Integration Planning
Map all CRM, PM tools, ERP systems, and data sources for unified connectivity.
Data Pipeline & Transformation
Build automated data extraction, transformation, and refresh pipelines.
Dashboard Development & Testing
Design interactive dashboards with drill-down, filters, and real-time data.
Deployment & Access Configuration
Configure workspaces, role-based access, and scheduled refresh automation.
Ongoing Optimization & Expansion
Add new data sources, refine KPIs, and extend reporting as operations scale.
What makes us different
Most consultancies build isolated dashboards. We build unified, real-time operational intelligence systems designed to connect every workflow into a single performance view.
Operations-First Methodology
Every implementation is designed around operational workflows, delivery processes, and performance management - not generic reporting templates.
Deep Platform Connectivity
Direct integration with ClickUp, Monday.com, Jira, Asana, CRM systems, and ERP platforms via REST APIs with automated refresh.
Real-Time Architecture
Live data connections and automated refresh pipelines that deliver up-to-the-minute operational visibility - not stale weekly exports.
Cross-Department Visibility
Unified operational metrics across sales, delivery, HR, and management - breaking down departmental data silos.
Microsoft & Power BI Expertise
Official Microsoft partner with deep Power BI implementation experience across operational analytics, governance, and licensing.
Scalable Analytics Framework
Modular dashboard architecture designed to grow with your organization - adding new data sources, teams, and metrics without rebuilding.
Data Case Studies
Case studies coming soon.
Build Operational Intelligence That Drives Execution
Book a strategy call and receive a comprehensive assessment of your current operational reporting architecture - before any commitment.
- Current operational reporting assessment
- Integration complexity mapping
- KPI alignment workshop
- Automation opportunity analysis
- Scalability roadmap
Related reading
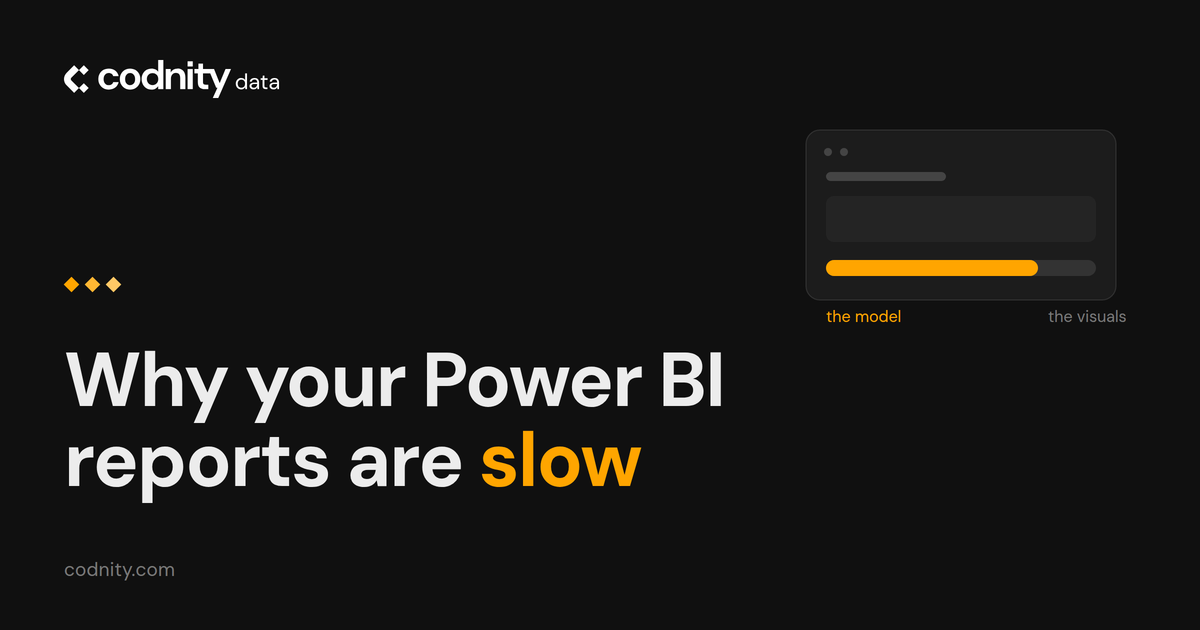
Why your Power BI reports are slow, and what actually fixes it
Slow Power BI is almost never a visual problem. It is the model underneath - too many columns, the wrong table shape, calculations running at view time instead of load time. Removing visuals treats the symptom. Fixing the model is what makes the report open in two seconds instead of forty.
Read article →
Why AI gets your numbers wrong, and how a modeled warehouse fixes it
AI gets your numbers wrong when it has to guess what a number means. Point it at raw tables and it invents a definition of revenue on the spot. Point it at a modeled warehouse, where revenue is defined once, and it reads the same figure your dashboard shows. The fix is modeling, not a better model.
Read article →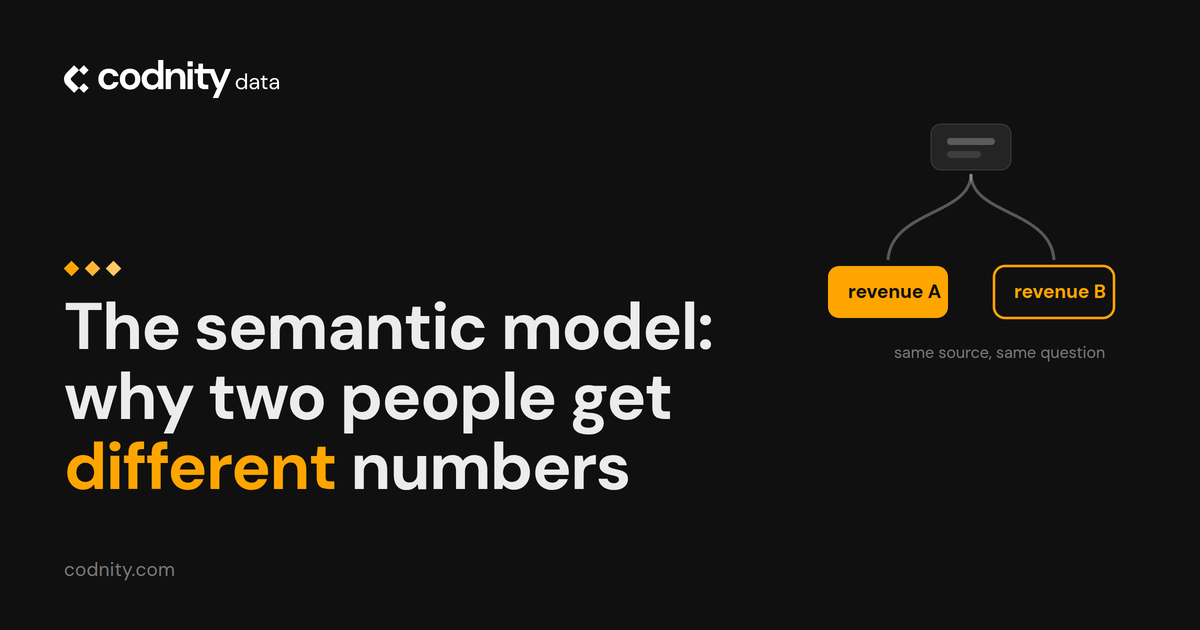
The semantic model: why two people get different numbers
When two reports disagree, the cause is almost never a bug. It is that the same metric was defined twice, slightly differently, by two people who both did reasonable work. A semantic model is where each measure gets defined once, so every report inherits the definition instead of recreating it.
Read article →Operational Reporting FAQ
Everything you need to know before starting an operational reporting engagement with Codnity Data.