There is a gap in most organisations' analytics stack — and it is not the tool they are missing. It is the connection between the operational system they rely on every day and the strategic intelligence that should be shaping their decisions.
Most teams running on ClickUp generate more data than they realise. Every task created, every status change, every hour logged, every sprint completed — it accumulates quietly in the background. But without a way to analyse it at scale, that data stays invisible. Managers run status meetings on gut feel. Capacity decisions are made on instinct. Projects overrun and nobody has a clear picture of why.
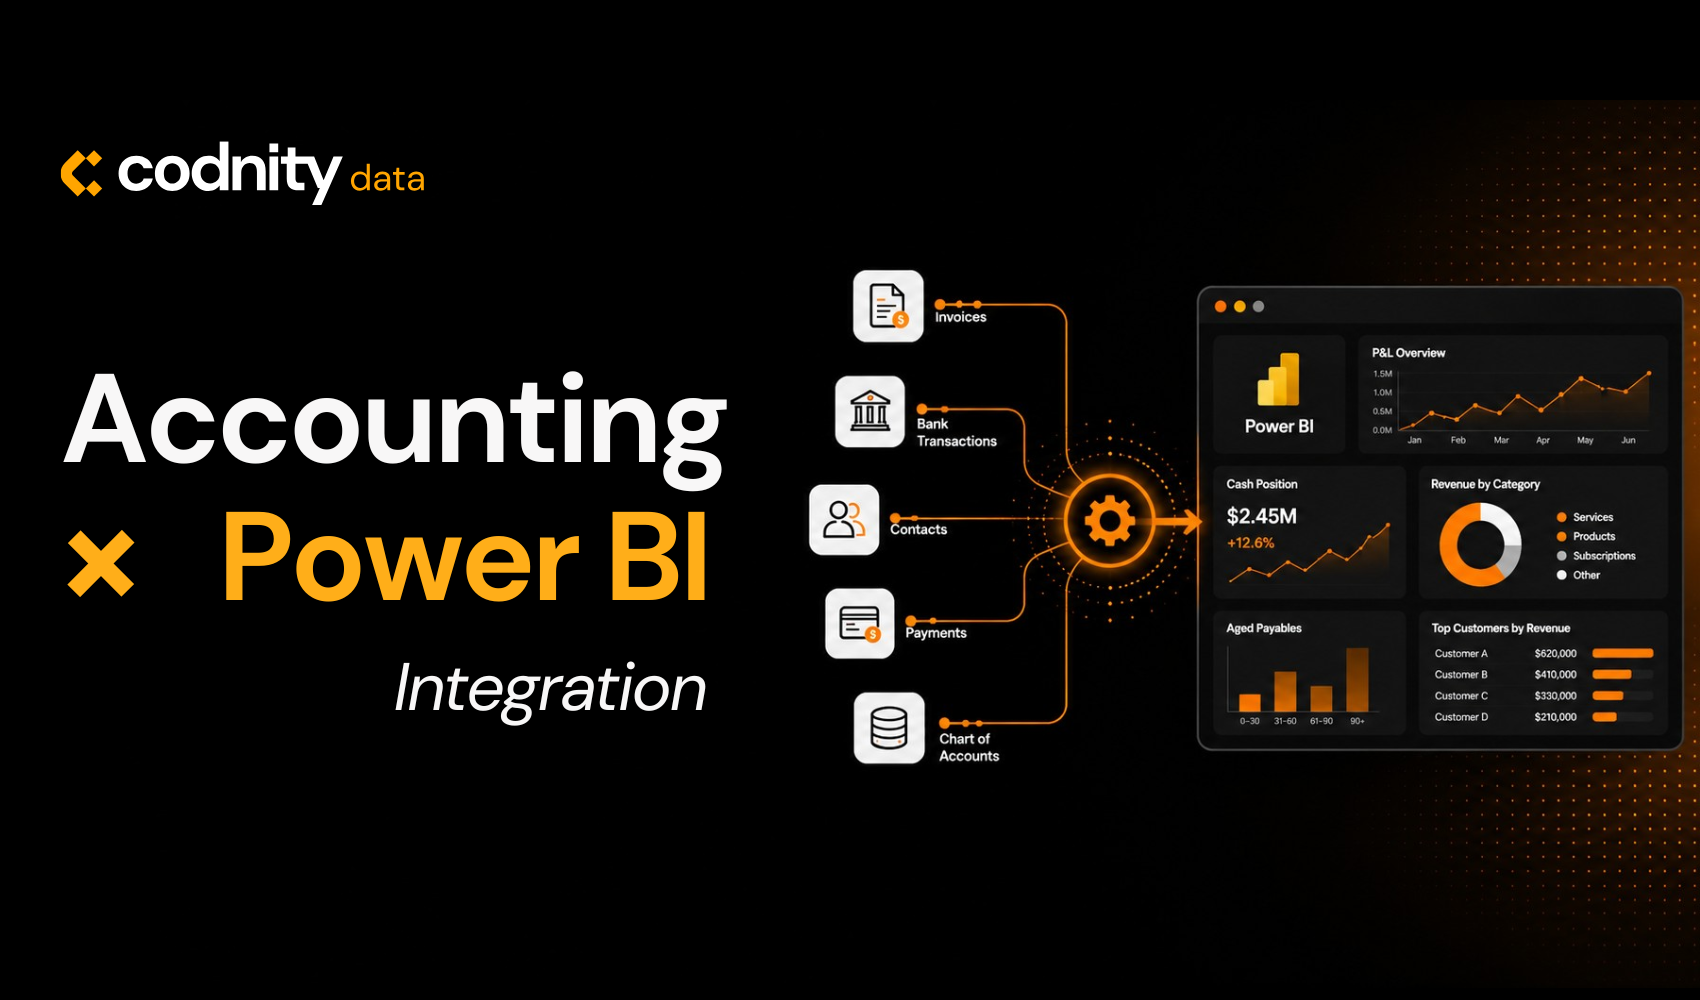
Connecting ClickUp to Power BI changes that completely. It takes the operational data already living in your workspace and turns it into something your organisation can actually use: trends, patterns, forecasts, and a shared view of performance that makes better decisions possible.
This is not about getting prettier charts. It is about running your organisation on evidence instead of assumption.
The Reporting Gap That Grows Quietly
ClickUp is excellent at what it was built for: organising work, assigning tasks, tracking progress, and keeping teams aligned on what needs to happen next. Its native reporting gives a reasonable view of current state — who has what assigned, what is overdue, how a sprint is progressing.
But current state is not the same as insight. The questions that actually drive operational improvement require a different kind of analysis: How long does it take this team to move a task from start to done — and is that getting better or worse? Which projects are consuming more hours than we estimated? Which team members are consistently over capacity while others have room to take on more? How does delivery performance this quarter compare to last year?
ClickUp was not designed to answer those questions. And the standard workaround — exporting data to spreadsheets, building manual operational reports, reconciling numbers across multiple exports — is time-consuming, error-prone, and always out of date by the time someone reads it.
This is the gap that a Power BI integration closes.
What ClickUp × Power BI Integration Actually Is
A ClickUp–Power BI integration is a structured, automated pipeline that extracts data from your ClickUp workspace via the API, models it in Power BI, and delivers live, interactive dashboards that refresh on a schedule — without any manual intervention from your team.
The integration is not a one-time export. It is a persistent connection: tasks, statuses, assignments, time tracking entries, custom fields, sprint data, and goal progress flow into Power BI continuously. The dashboards built on that data update automatically — typically daily or more frequently, depending on your refresh configuration.
The result is a reporting environment where the operational data your teams generate every day becomes decision-ready intelligence. Not a static snapshot, not a week-old spreadsheet — a live model of your organisation's performance that anyone with the right access can interrogate in real time.
What Running Without It Actually Looks Like
The team without the integration
Runs capacity decisions based on project managers' gut feel. Discovers delivery problems at the end of a sprint rather than mid-cycle. Spends a week every quarter manually assembling performance data from exports. Has no reliable way to show stakeholders whether the team is getting faster or slower, or whether any given project was profitable.
The team with the integration
Sees utilisation data in real time. Identifies bottlenecks while they are still recoverable. Runs quarterly reviews where the performance data is live, accurate, and drill-through capable. Makes hiring and prioritisation decisions based on evidence. And has a conversation with clients that most agencies cannot have — because the numbers are always current and always trustworthy.
The difference between these two teams is not budget or technical sophistication. It is whether someone decided to build the connection between the data they were already generating and the intelligence they needed to act on it.
Why the Data Model Matters More Than the Dashboard
There is a common misunderstanding about what makes a ClickUp–Power BI integration valuable. Most organisations focus on the dashboards — the visuals, the charts, the KPI tiles. The dashboards matter, but they are downstream of something more important: the data model.
ClickUp workspaces are messy by nature. Tasks get renamed, statuses evolve, custom fields change meaning over time, and the same concept might be tracked differently across different teams' lists. A raw API connection to Power BI surfaces all of that complexity without resolving it. You get data — but not data you can trust.
Building the integration properly means doing the modelling work first: normalising status histories, mapping custom fields to consistent definitions, establishing relationships between tasks, lists, folders, spaces, and users, and designing a data structure that reflects how your organisation actually works.
When the model is right, the dashboards are straightforward. When the model is skipped, every dashboard becomes a liability.
What the Integration Makes Possible
Once ClickUp data flows cleanly into Power BI, the reporting questions that were previously unanswerable become routine. Delivery performance analysis — cycle time, lead time, SLA adherence, on-time completion rates — becomes automated and continuous rather than a manual exercise carried out at quarter-end.
Capacity and resource planning shifts from guesswork to evidence. Utilisation rates by team member, identification of who is consistently operating above capacity, and forecasting of upcoming workload based on the task pipeline already in ClickUp — all of it becomes visible and current.
Project profitability becomes measurable in a way that is simply not possible inside ClickUp alone. When time tracking data is connected to rate information — from ClickUp's custom fields or from a linked financial system — you can see exactly how many hours each project consumed, what that cost, and whether it aligned with what was estimated and budgeted.
And because Power BI can combine ClickUp data with other sources — CRM data, accounting systems, HR platforms — the integration becomes a foundation for a broader analytics layer, not just a ClickUp reporting tool.
How the Integration Is Built
The process Codnity Data uses to build ClickUp–Power BI integrations follows four stages, each of which is necessary for the result to be reliable and genuinely useful.
Understanding workflows and reporting requirements
We map the organisation's ClickUp structure — Spaces, Folders, Lists, custom fields, task types — to understand what data exists and how it's organised. We identify the KPIs that matter to different stakeholders and define a reporting framework that reflects real decision-making needs. This is where the scope is established and the dashboards are designed before any code is written.
Building the API integration and data model
We connect directly to ClickUp via the REST API, extracting tasks, statuses, time entries, assignments, sprints, and custom fields on a scheduled basis. We cleanse and normalise the data, then design a scalable Power BI data model with relationships, calculated columns, and DAX measures that turn raw task data into meaningful metrics.
Developing dashboards built for decisions
We build role-specific dashboards: executive summaries for leadership, delivery dashboards for project managers, and capacity views for team leads. Every visual is designed for clarity — the right chart type, the right level of detail, and the right drill-through paths so users find answers in seconds.
Deployment, automation, and continuous improvement
We configure scheduled data refresh, workspace permissions, and row-level security so the right people see the right data automatically. We deliver documentation and data dictionaries so your team can build on the foundation we create — and we provide ongoing refinement as your processes evolve.
The Decisions It Changes
The measure of a good analytics integration is not whether it produces interesting charts. It is whether it changes the decisions being made — and the quality of those decisions.
Organisations with a functioning ClickUp–Power BI integration make different capacity decisions, because they can see utilisation data in real time rather than relying on subjective assessments. They make different prioritisation decisions, because they can see the actual delivery impact of adding work to a team already at capacity. They make different hiring decisions, because they can distinguish between a capacity problem and a throughput problem — two conditions that look identical from the outside but require completely different responses.
They also have conversations that organisations without the integration simply cannot have. A quarterly review where the performance data is live, accurate, and drill-through capable is a fundamentally different meeting from one where someone spent a week manually assembling a presentation from exported spreadsheets.
The compounding effect of better decisions made consistently over months is significant. It is the kind of operational advantage that does not show up in a single headline metric — but it accumulates.
A Foundation, Not a Feature
The most important thing to understand about a ClickUp–Power BI integration is that it is not a reporting feature. It is a foundation — for a data-driven operating model where operational data flows automatically into decision-making, rather than sitting inert in a project management tool.
Organisations that build that foundation now gain something that compounds over time. The data model grows richer as more history accumulates. The dashboards become more useful as the team learns to rely on them. The decisions improve as the quality and currency of the underlying data becomes something that can be trusted without verification.
The organisations that continue to manage by manual exports and spreadsheet reconciliation face a different trajectory: a gradually widening gap between their operational visibility and that of the competitors who built the infrastructure when the opportunity was straightforward.
The question is not whether operational analytics will eventually matter to your organisation. It is whether you build the foundation before it becomes urgent — or after.
Ready to connect your ClickUp to Power BI?
We've built ClickUp–Power BI integrations for teams across logistics, finance, software development, and professional services — organisations that had outgrown manual reporting and needed something they could trust.
If your organisation runs on ClickUp and your reporting hasn't kept pace, we're happy to show you what's possible. No jargon, no oversell. Just an honest look at what the data you're already generating could be doing for you.
Frequently asked questions
Does ClickUp have a native Power BI connector?
How long does it take to build a ClickUp Power BI integration?
Can Power BI combine ClickUp data with other systems?
What ClickUp plan do I need for the API integration?
Will the Power BI dashboards update automatically?
What is the difference between ClickUp's built-in reports and Power BI dashboards?
Does the integration require a dedicated data team to maintain?
Published · Updated · Last reviewed
Reviewed by Elvijs Veide, Co-founder