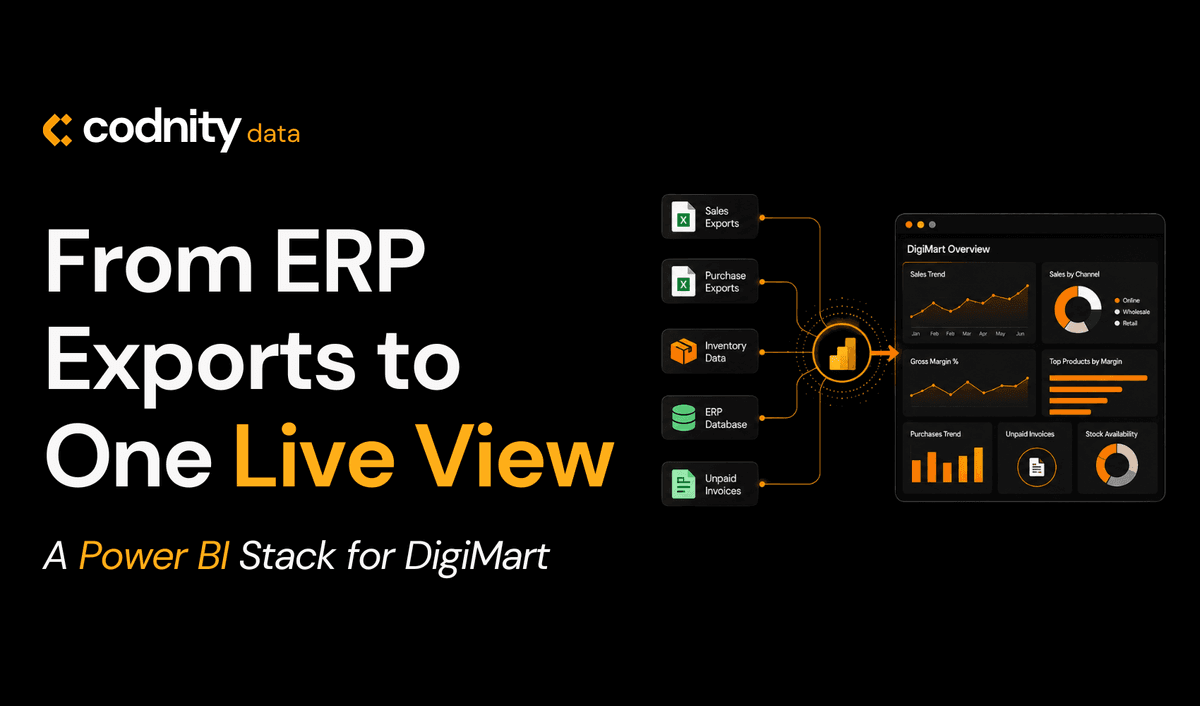
- 5fact tablessales, purchases, etc
- 32business measures
- Dailystock availability
We've been working with CCLM SIA - the team behind DigiMart - on the analytics side of a fast-growing e-commerce and wholesale business. They sell electrical appliances, smart devices, generators, gardening gear and toys across the Baltics and Nordics, with the product catalogue running into thousands of SKUs across dozens of brands.
When you're moving that much variety through one warehouse on Mūkusalas iela, the question isn't whether the data exists. It's whether you can actually see it without exporting three spreadsheets first.
The Challenge
The numbers were all there - they just weren't anywhere useful. Sales, purchases, inventory and customer data lived inside Moneo. Pulling anything out meant exporting reports, stitching them together, and trusting that the version on someone's laptop was still the latest one.
For a team running an e-commerce operation with thousands of SKUs and a heavy supplier base, that's a slow way to answer fast questions. Which brands are actually profitable after additional expenses? Which items sat without stock last month? How much of last quarter's revenue is still unpaid? All answerable - eventually - but never in the same place, and never quickly.
The team needed reporting that kept up with the business, not the other way around.
The Mission
Build a Power BI model that connects directly to Moneo, holds the full picture in one schema, and gives the DigiMart team answers to the questions they actually ask - about margin, stock availability, supplier costs and unpaid invoices - without anyone having to export anything.
The brief wasn't "make a dashboard." It was "make the data trustworthy and the answers fast."
Our Approach
We started from the schema. Moneo exposes everything via API, so the first job was modelling it properly - separating sales invoice headers from line items, purchase invoices from purchase lines, and tying both back to a clean items dimension and a unified contacts dimension that handles customers and suppliers in one place.
From there it was about discipline:
- One Calendar table driving every time intelligence calculation;
- A central Calculations table holding every business measure, organised by display folder;
- Clear measure naming - Sales, Cost, GP, GP %, Adjusted GP %, Unpaid sum - so the team can read a card without checking the formula;
- An additional expenses table fed into the gross profit logic, so margin reflects shipping, handling and other non-invoice costs.
The model holds five fact tables and six dimensions. Sales runs through receipts, invoice headers and invoice lines. Purchasing mirrors that on the supplier side. Items and contacts are shared across both.
Key Features
A unified semantic model
Sales, purchasing, stock and customer data sit in one star schema. Filter by item group, by customer category, by deal type, by salesperson - the model resolves it without help.
Adjusted gross profit
A standard GP measure tells you the margin on the invoice line. The adjusted version subtracts allocated additional expenses, so the team sees the real margin - the one that matters when deciding which suppliers and SKUs to keep pushing.
Provision of Goods (POG) analytics
A custom DAX engine that, for any selected month and SKU, looks backwards across a defined lookback window and calculates:
- Daily stock availability % (share of days the item was actually in stock)
- Days with no stock within the window
- Quantity sold vs quantity purchased over the same window
- Remaining cumulative stock for any single SKU, day by day
- Last purchase date, ignoring the calendar filter so you can see how stale the supply is
Stockouts no longer hide inside totals - they show up as a number, per item.
Receivables visibility
Unpaid sum and purchase unpaid sum measures expose what's outstanding on both sides of the ledger, sliced by customer, supplier or period.
Purchase analytics
Purchase amount, quantity and item-level purchase price feed into supplier and item-group performance views - useful when re-negotiating contracts.
It's not a single dashboard. It's a model that powers however many views the team needs.
What Changed
The exports stopped.
Stock availability is now a number on a page, not a Friday afternoon project. Margin conversations start from a measure everyone agrees on. Unpaid invoices are visible the moment the model refreshes.
And because everything sits on one Calendar and one set of measures, two people asking the same question get the same answer. That part matters more than any single chart.
Last Words
DigiMart's catalogue is going to keep growing - more brands, more markets, more SKUs. The model is built for that. Star schema, clear measures, one date table, and a POG engine that scales to whatever depth of stock history the team wants to look at.
This wasn't about making the data prettier. It was about making it usable - so the people running the business can spend their time on decisions, not on stitching together spreadsheets.
Want to know more about this project or how we approach Power BI builds on top of Moneo? Drop us a line. We're happy to talk.
Frequently asked questions
Why Power BI on top of Moneo - couldn't the ERP report on its own?
It can, but only on what it knows. Moneo gives you operational reports inside the system; it doesn't give you a margin view that nets additional expenses against gross profit, or a daily stock-availability percentage per SKU. Power BI sits next to Moneo, pulls the same data via API, and lets us model the questions the business actually asks.
What does "Provision of Goods" actually measure?
It answers two related questions per SKU: how many days in the lookback window did the item have zero stock, and what share of days was it actually available to sell. Both calculations look backwards from the end of the selected month, ignore the calendar slicer where needed, and return zero stockout days when the item was always in stock. It's the stock equivalent of an uptime metric.
Is this just sales reporting?
No. The model covers sales (receipts, invoice headers, invoice lines), purchasing (purchase invoice headers and lines), items and item groups, contacts (customers and suppliers in one dimension), deal types, payment types, customer categories, and additional expenses. Sales and purchasing share the same items and contacts dimensions, so any item-level or supplier-level view is consistent across both sides.
Published · Updated · Last reviewed

By Elvijs Veide, Co-founder