Data exists, intelligence doesn't
Most organizations generate massive volumes of financial, operational, and CRM data. But without structured Power BI development and business intelligence architecture, that data remains:
Manual & Spreadsheet-Driven
Finance and operations teams export data, reconcile numbers, and rebuild reports every month.
Disconnected Across Systems
Accounting platforms, CRM systems, ERP environments, and operational tools operate in silos without unified reporting.
Inconsistent Across Departments
Revenue, margin, utilization, and KPI definitions vary between teams due to missing data modeling standards.
Limited in Automation
No structured ETL pipelines, incremental refresh logic, or governed workspace architecture.
Not Built for Scale
As integrations grow, reporting becomes fragile, slow, and increasingly unreliable.
Power BI should not be an optional reporting layer. It should be the structured foundation of your business intelligence ecosystem.
Our Data & Power BI Services
We build integration-first, architecture-driven analytics environments that eliminate manual reporting and enable automated, governed business intelligence.
Power BI Development & Consulting
Enterprise-grade dashboard development, advanced data modeling, ETL implementation, governance setup, and scalable Power BI architecture design.
Explore service →Financial Reporting Automation
Automated P&L, balance sheet, and cash flow reporting integrated directly with Xero, QuickBooks, ERP systems, and accounting platforms.
Explore service →Operational Reporting & Performance Analytics
Real-time workflow, CRM, project management, and delivery analytics built on structured Power BI environments.
Explore service →Data warehouse + AI
A managed cloud data warehouse that unifies every source into one governed model, refreshed daily, with an AI layer your team queries in plain English.
Explore service →Not sure which reporting layer you need?
We assess architecture, integrations, and automation potential before recommending structure.
Architecture-First Power BI Methodology
We don't build isolated dashboards. We engineer full business intelligence systems.
Discovery & KPI Alignment
Define financial, operational, and performance KPIs aligned with business objectives.
Data Integration & ETL Architecture
Implement structured ETL (Extract, Transform, Load) pipelines connecting accounting systems, CRM platforms, ERP environments, REST APIs, and databases.
Data Modeling & DAX Engineering
Design scalable semantic models using dimensional modeling (fact & dimension tables) and implement advanced DAX calculations for time intelligence, margin logic, forecasting, and performance metrics.
Visualization, Governance & Automation
Deploy secure Power BI Service environments with Role-Level Security (RLS), workspace governance, automated refresh scheduling, and licensing support. The result: A governed, automated, and scalable business intelligence environment.
How our data stack works
From raw data sources through ETL pipelines, semantic modeling, and Power BI delivery - a governed, automated intelligence layer.
What Structured Power BI Changes
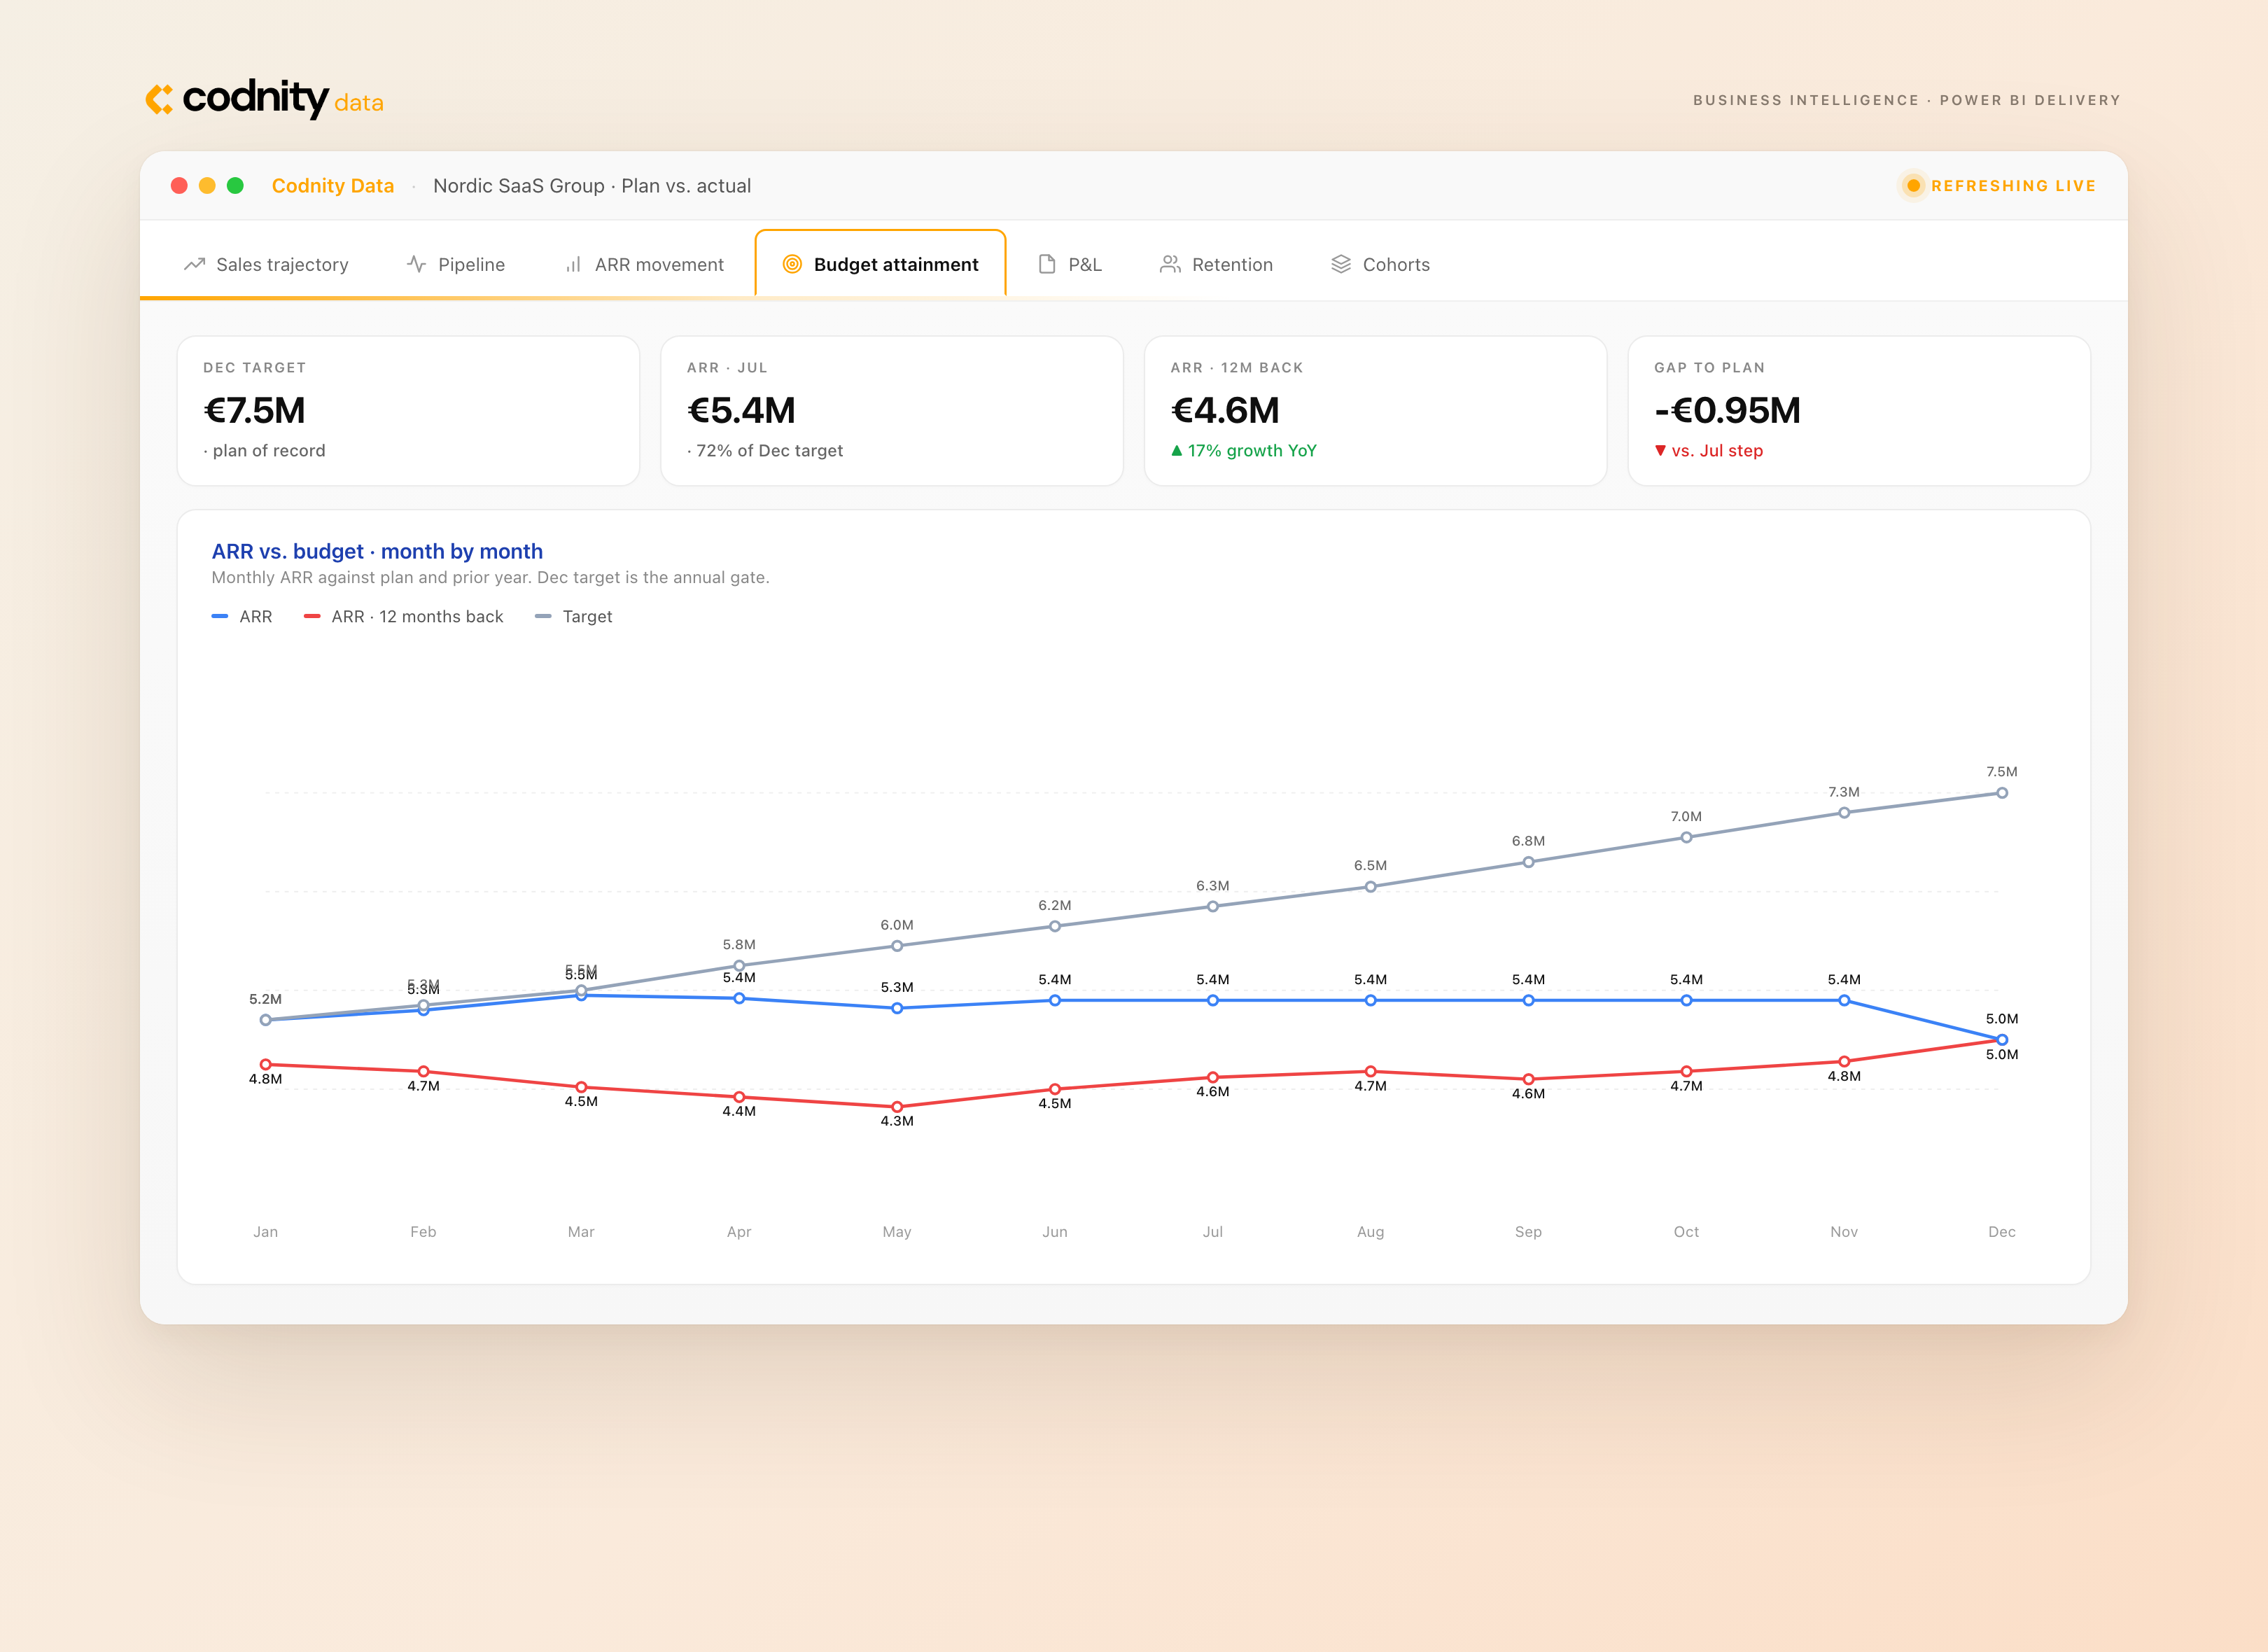
Power BI for a Nordic Loyalty-Tech SaaS
A Power BI reporting stack for a Nordic B2B SaaS company whose platform runs digital loyalty programs for convenience and fuel retail chains across Europe and the US. Two connected reports share one calendar and one currency logic: the first makes recurring revenue trustworthy on any given day, not just at month-end; the second turns hand-tracked KPIs into a live board across six departments, actual against target. Not prettier dashboards - one version of the numbers the whole business can trust.
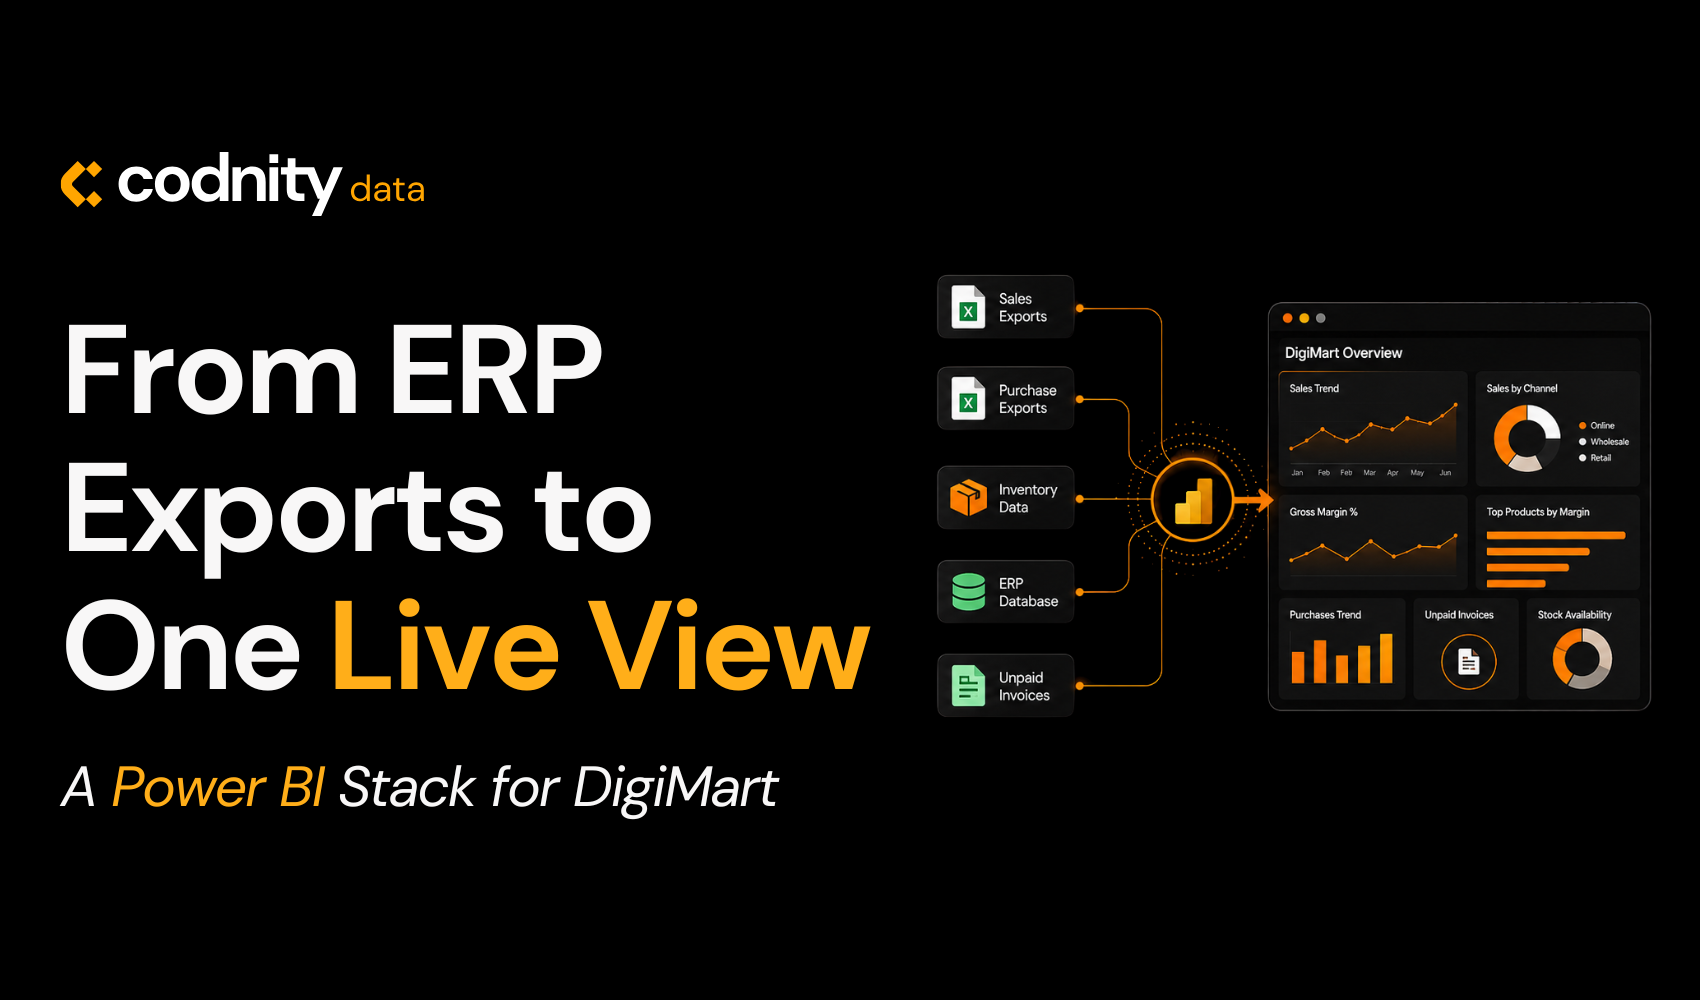
A Power BI Stack for DigiMart
A Power BI semantic model built by Codnity Data for CCLM SIA - the company behind DigiMart, a Baltic e-commerce and wholesale operator selling Samsung, Bosch, Philips, Xiaomi, Heinner and other appliance brands across Latvia, Lithuania and the Nordics. The model pulls live data from their Moneo accounting system via API, replaces a stack of spreadsheet exports, and gives the team one place to look at sales, gross profit, purchases, unpaid invoices and stock availability - including a custom "Provision of Goods" engine that tracks how many days each SKU sat with no stock.
Let's Assess Your Current Data Architecture
We review your current reporting architecture, identify automation gaps, and define the right Power BI implementation strategy - before any commitment.
- Reporting workflow & integration assessment
- Automation gaps & governance readiness
- Scalability constraints & architecture planning
- Response within 24 hours
Power BI & Business Intelligence Insights
Why your Power BI reports are slow, and what actually fixes it
Slow Power BI is almost never a visual problem. It is the model underneath - too many columns, the wrong table shape, calculations running at view time instead of load time. Removing visuals treats the symptom. Fixing the model is what makes the report open in two seconds instead of forty.
By Elvijs Veide
Read article →
Why AI gets your numbers wrong, and how a modeled warehouse fixes it
AI gets your numbers wrong when it has to guess what a number means. Point it at raw tables and it invents a definition of revenue on the spot. Point it at a modeled warehouse, where revenue is defined once, and it reads the same figure your dashboard shows. The fix is modeling, not a better model.
By Elvijs Veide
Read article →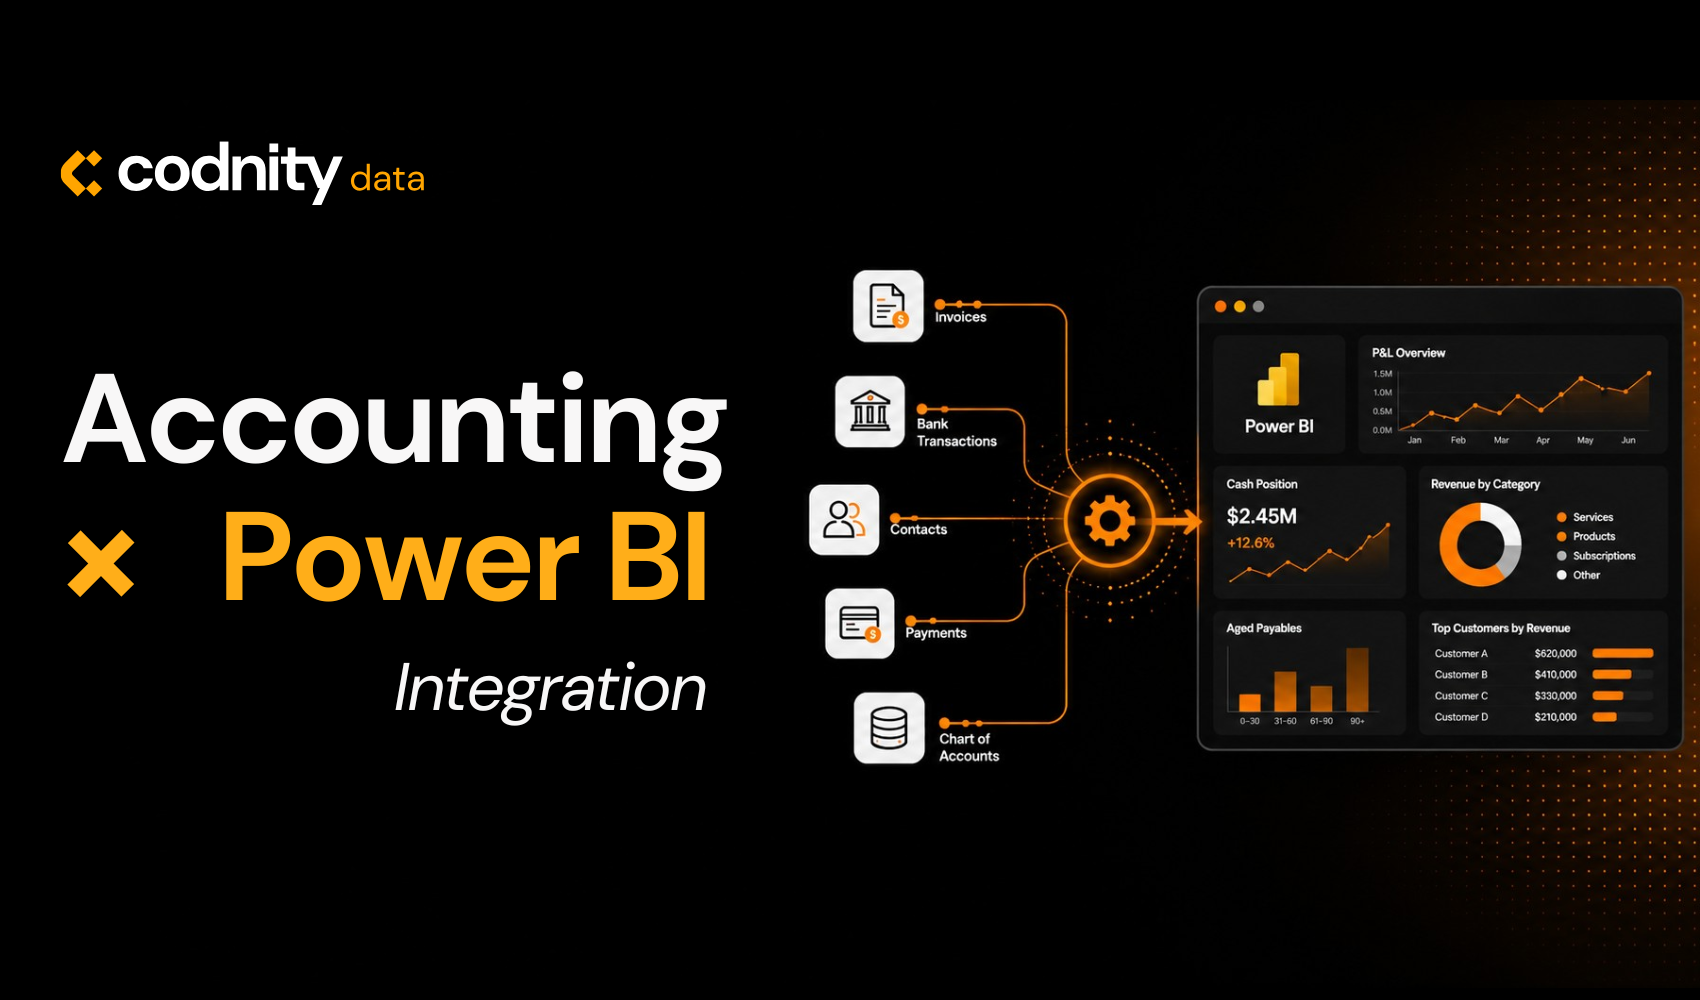
Accounting Data × Power BI Integration
Connecting your accounting system (Xero, QuickBooks, Moneo) to Power BI replaces manual monthly reporting with automated, continuously refreshed dashboards. Finance teams gain a live P&L, real-time cash position, and drill-through access to underlying transactions - without manual exports. The critical component is the semantic model, which maps the chart of accounts to how leadership reads the business.
By Elvijs Veide
Read article →What you might ask
The most common questions about our Power BI development services, how we price projects, and what working with Codnity Data looks like.